Abstract
Variable Frequency Drives (VFDs) are increasingly common, especially with the push for energy efficiency (in residential applications) and better motor control (in industrial applications). Unfortunately, the gains made with VFDs are often at the expense of power quality – they are often sensitive to PQ problems and can also be a source of PQ problems. Some recommendations for PQ monitoring of VFD systems are presented here.
A traditional AC motor is a simple electromechanical device that presents a simple load to the AC power system. A motor running at speed is a linear load with a mostly predictable inductance that can be canceled with capacitors. The voltage sag from the starting current is usually the most severe PQ problem caused by a simple motor; this can be mitigated with a soft-start controller, or upsizing the wiring or distribution transformer feeding it.
Simple motors are also fairly forgiving of incoming PQ issues. Rotational inertia can keep the motor spinning through short voltage sags or even dropouts, and voltage unbalance lead to heating issues in a predictable, gradual manner.
VFD Basics
The situation with VFDs is more complex. Figure 1 shows a basic VFD schematic. The incoming 3 phase AC voltage is rectified by a series of diodes. This rectified voltage is smoothed into a DC voltage by filter capacitors, and sometimes inductance. The DC bus capacitance also provides some energy storage for sag ride-through, although its primary purpose is to “fill in the gaps” during the low points of the voltage sine waves. The motor controller contains a microprocessor which switches the DC bus voltage into variable-width pulses that are applied to the motor through semiconductor switches (usually SCRs or IGBTs) in the inverter section. By precisely controlling the width of the pulses applied to the motor, the controller can adjust the motor speed. By converting from AC to DC, the VFD removes any dependency on the line frequency, and by sampling the DC bus voltage and motor current, the controller can fine-tune the pulses to account for changes in line voltage, motor load, etc. The pulses fed to the motor are much higher frequency than the 60Hz line – often several kilohertz. Usually the pulse frequency is constant during normal operation, while the width of the “on” portion of the pulse period is varied to change the motor power.
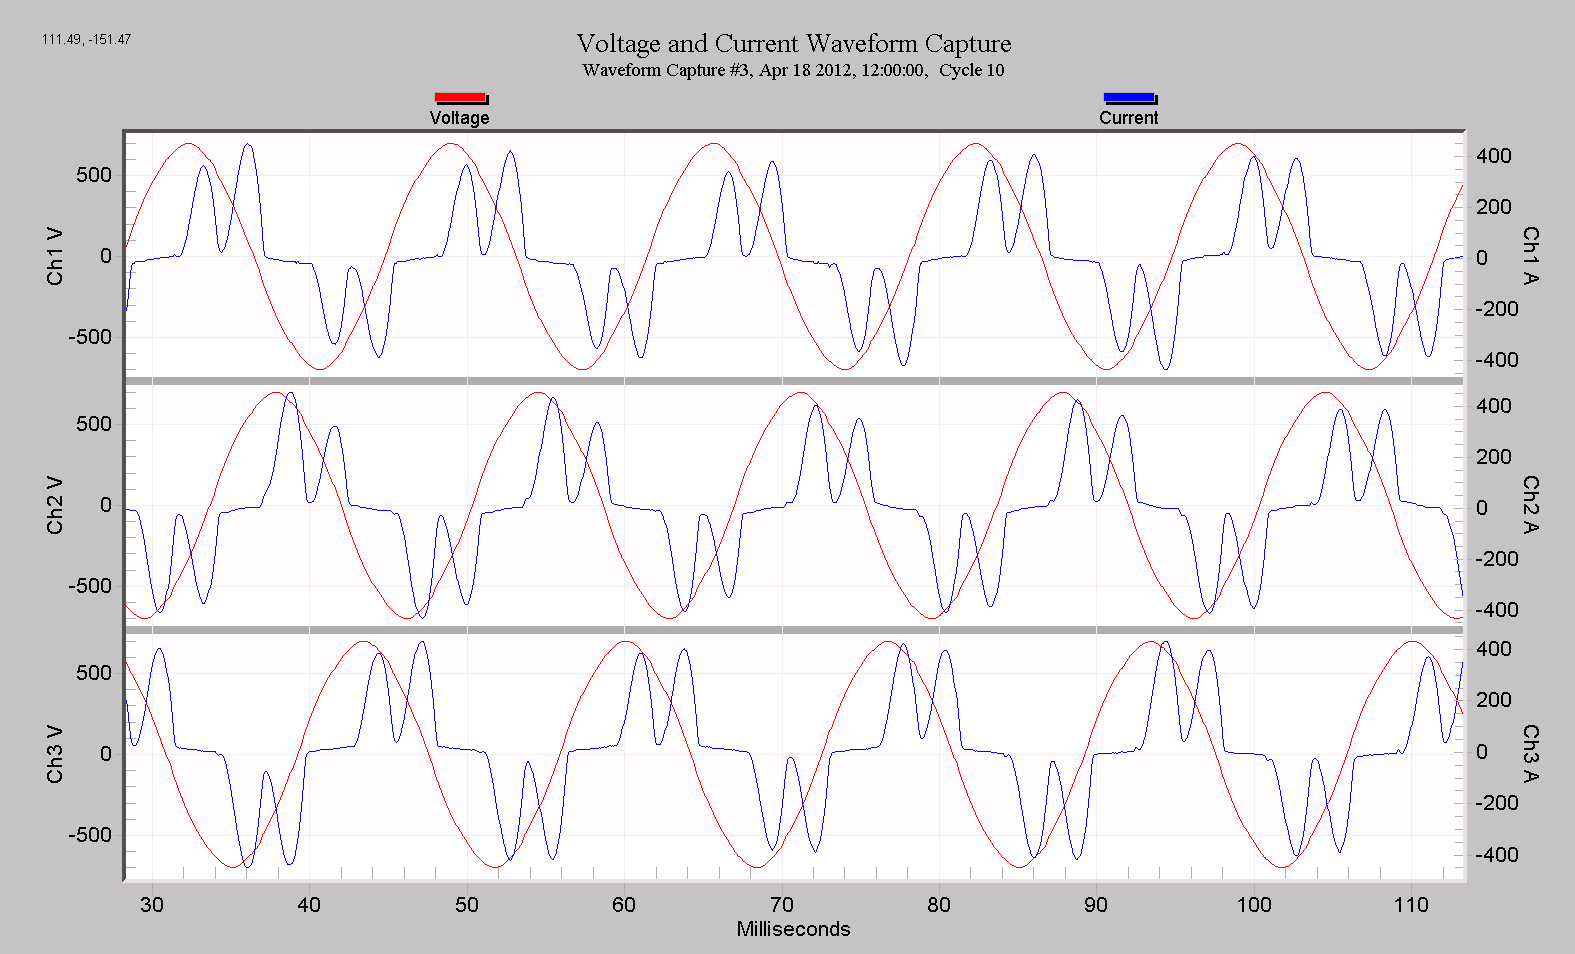
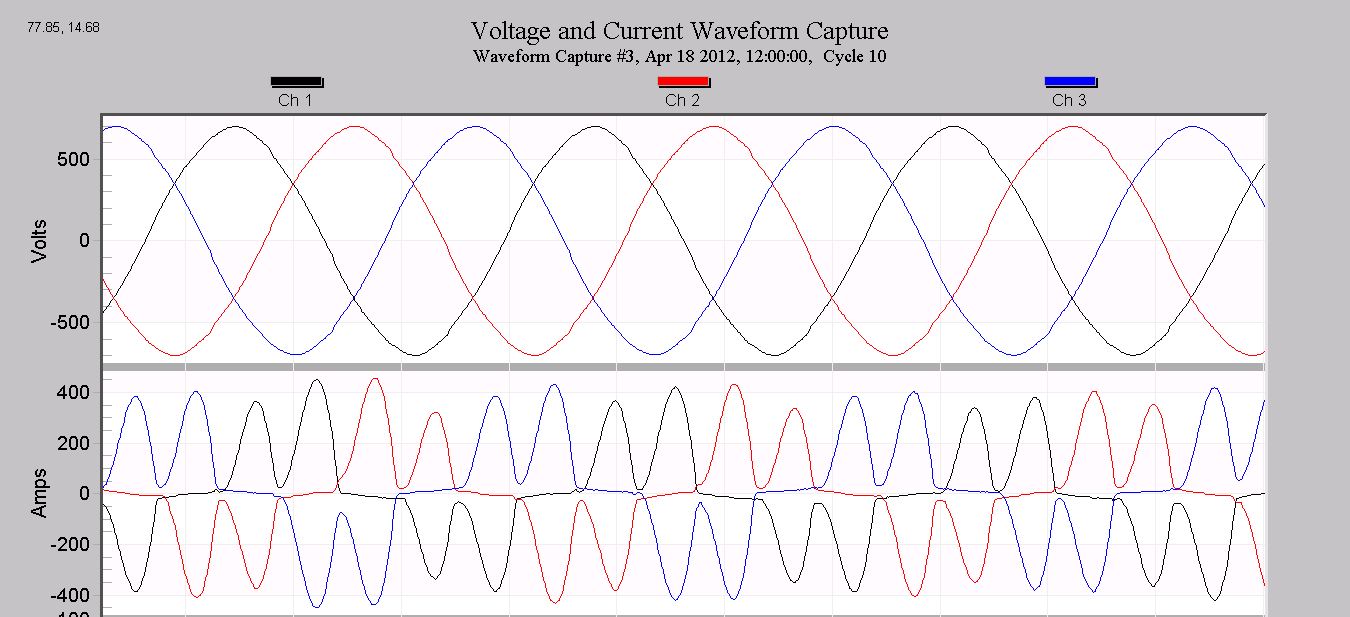
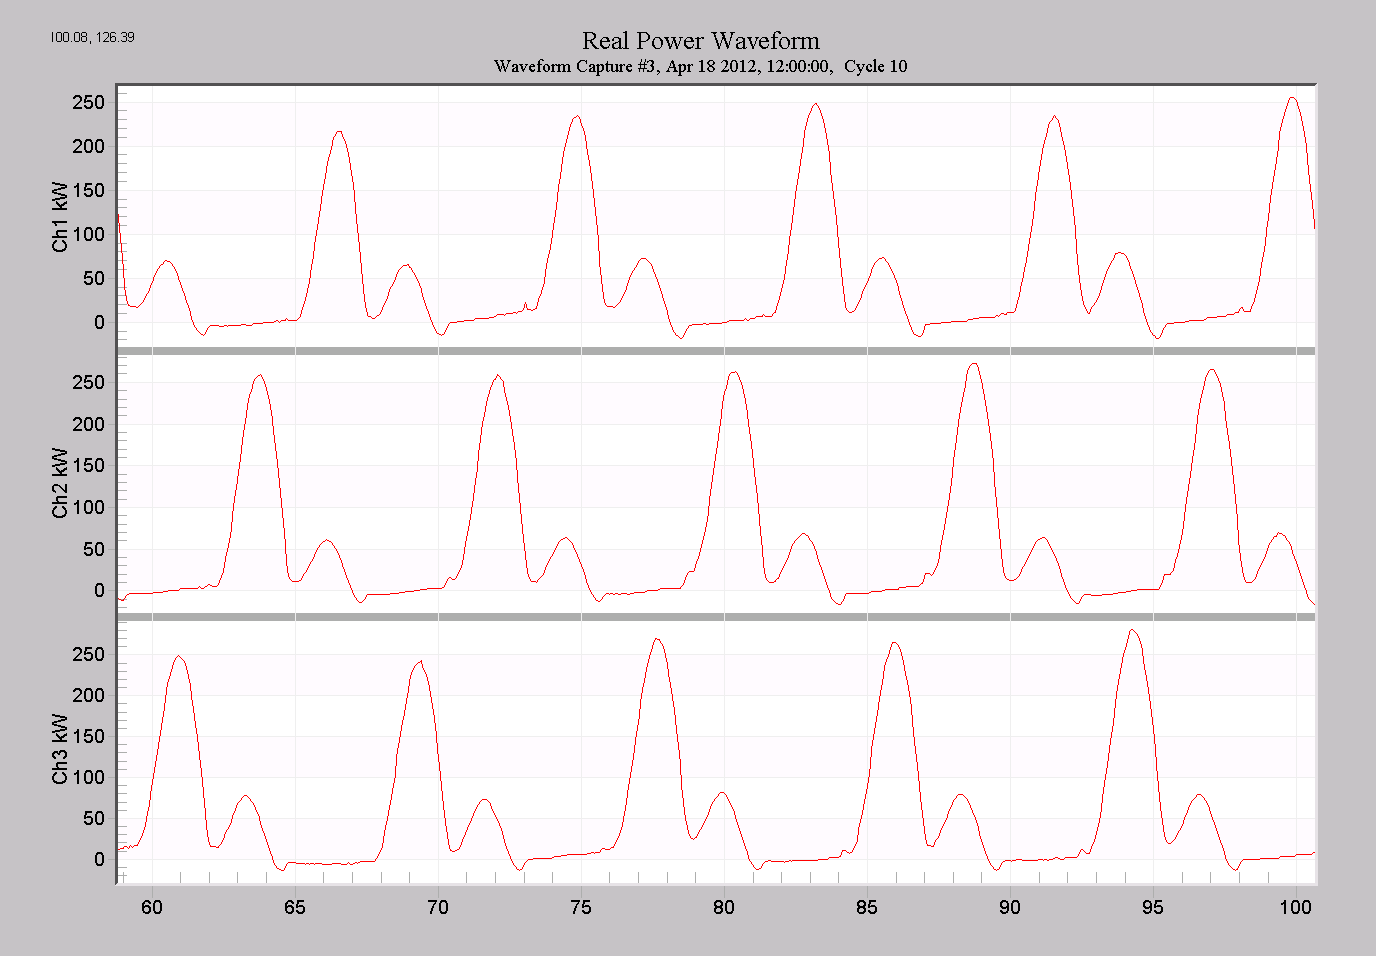
The AC current waveforms from a VFD are shown in Figure 2. The diodes conduct current from each of the 3 phases in turn, as each line-line voltage goes through a positive and negative voltage peak, for a total of 6 pulses in a 360° conduction angle. The same waveforms are shown with voltages and currents on the same axes in Figure 3; here the combination of currents is clearer. The total power is drawn from each phase in sequence, as seen in the power graph in Figure 4.
PQ Problems Caused by VFDs
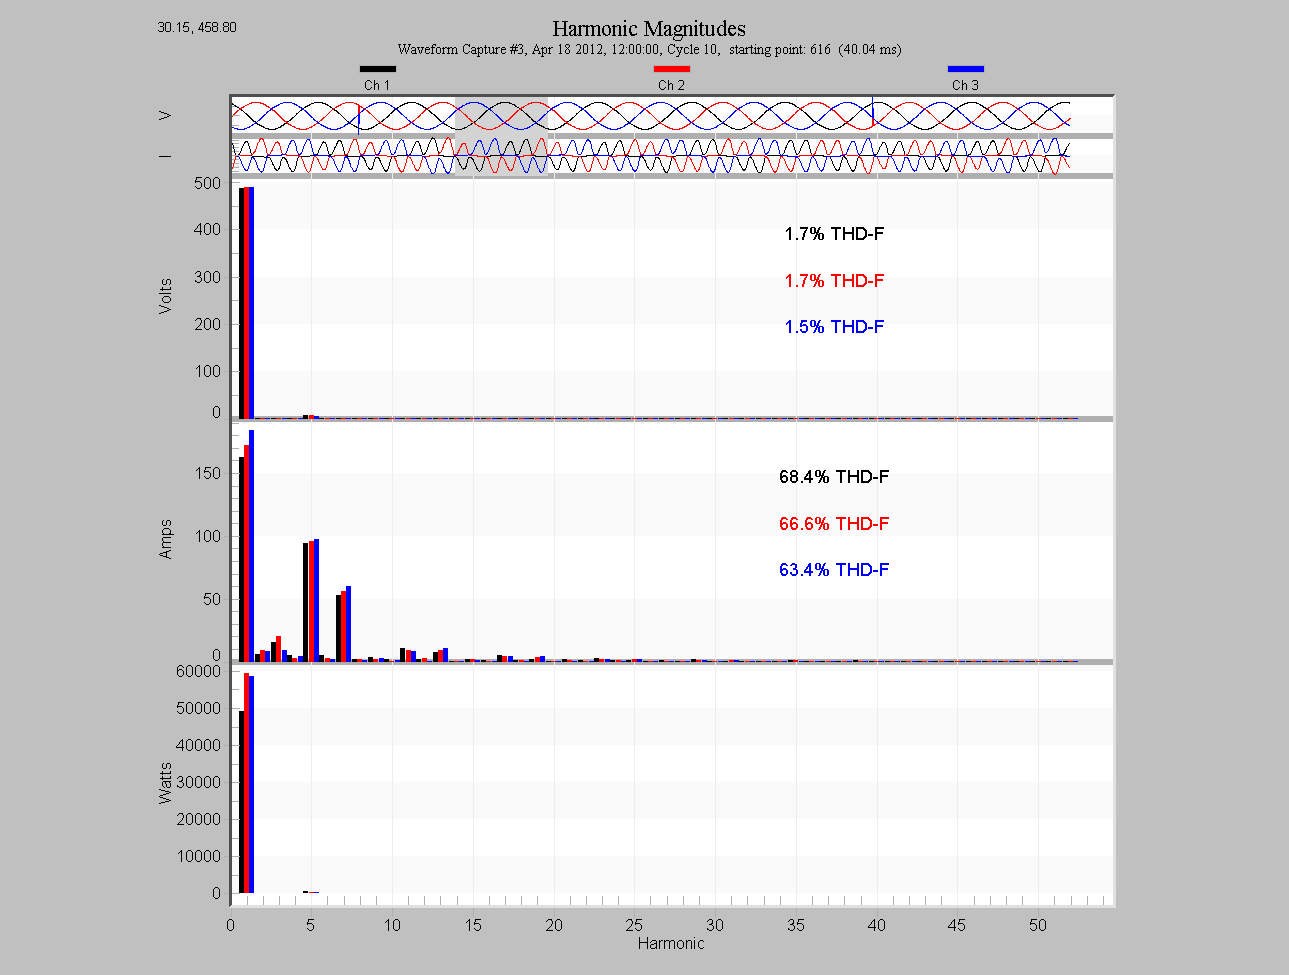
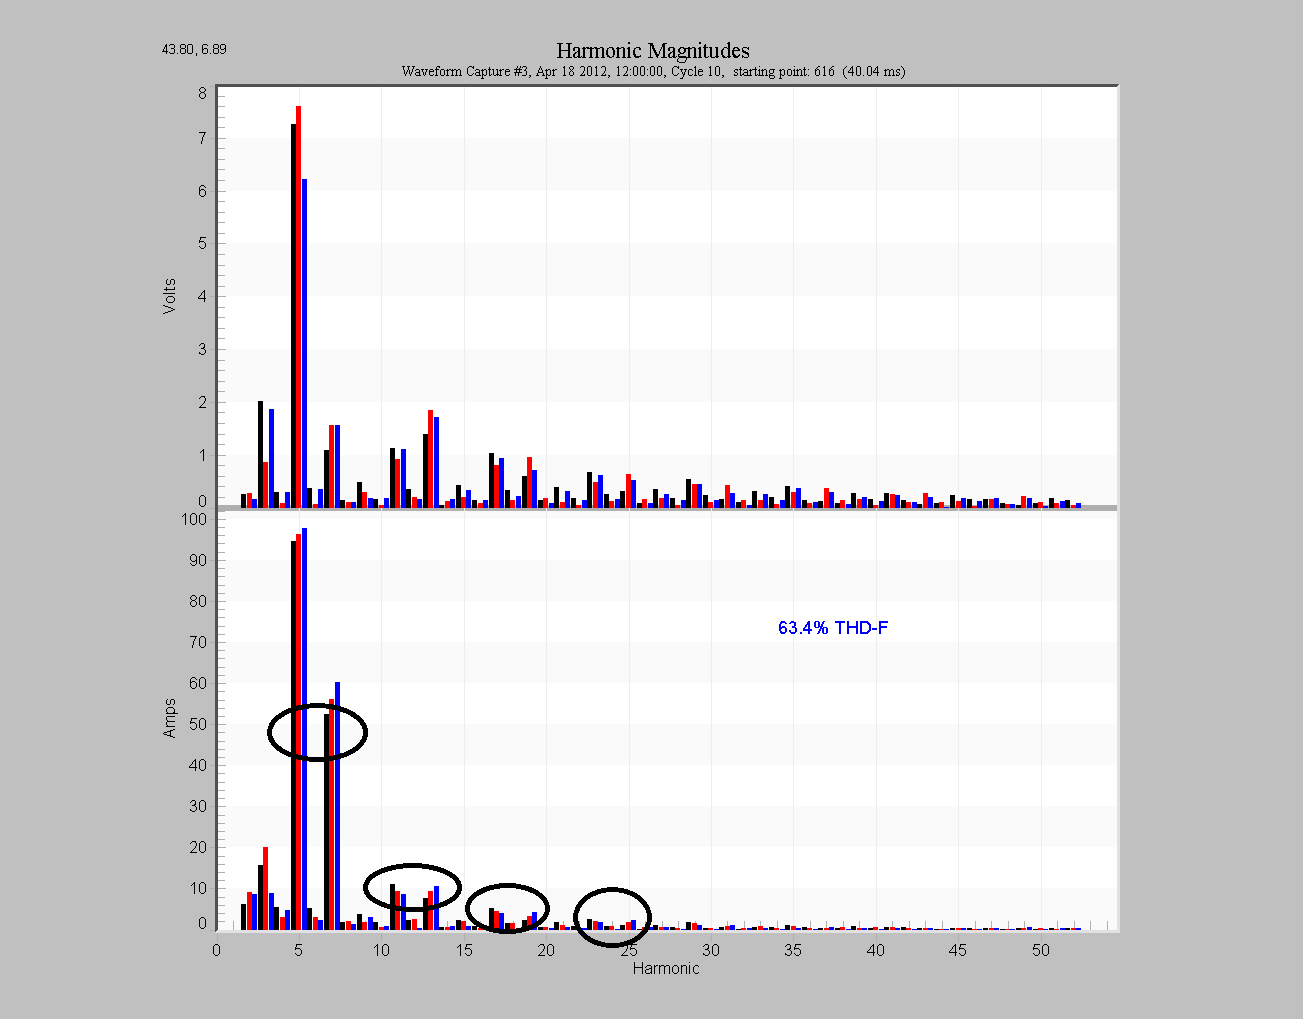
The main PQ problem caused by VFDs is excessive harmonics. The VFD is a very nonlinear load, as shown by the current waveforms in Figure 2 and the harmonic plot in Figure 5. The VFD current THD is a very high 64, and the voltage THD is even a bit high at 1.7%. A 6 pulse converter like Figure 1 produces harmonics of order n according to n=6k±1, where k=1,2,3, … , e.g. 5th and 7th, 11th and 13th, 17th and 19th, etc. Notably absent in the list is the 3rd harmonic – in fact, no triplen (odd multiples of three) harmonics are present. In Figure 6, the fundamental is toggled off and the graph expanded to show more detail. The 6k±1 pairs are circled on the current harmonics, and these pairs are even visible in the voltage harmonics, indicating that a VFD (or other 6-pulse inverter) is likely the cause of the voltage THD. A differing pattern on the voltage (or no harmonics at all) would suggest that the system is stiff enough to not be affected by the monitored load.
An advantage of VFDs is a low starting current. The VFD controller is usually set to ramp the motor up to speed gradually, resulting in a starting current that may not exceed the full run current. Here the VFD is much better than a traditional motor, where the starting current is several times the run current, even with a soft-start circuit. Consequently, VFDs cause fewer voltage sags than traditional motors.
PQ Problems That Affect VFDs
In addition to causing PQ problems by introducing harmonics, VFDs can also be sensitive to several PQ issues. Unlike a traditional motor, where a momentary PQ issue may cause a momentary motor issue (e.g. a voltage sag producing a slight lurch in the motor output), a VFD often shuts down completely. These “nuisance trips” are caused by the motor controller in Figure 1 turning off the motor drive pulses in response to the PQ issue. These controllers are quick to turn the motor off, but generally don’t restart it automatically.
The default controller settings are often set very conservatively from the factory and left unchanged by the end-user. As little as a 10% sag could cause a nuisance trip, and often the solution is to simply reprogram the controller with more suitable settings. The bulk capacitance of the DC bus filter may have enough energy storage to ride through a half-cycle deep sag, but it’s usually not sized for more than that.
Voltage unbalance is another sensitive area for VFDs. Unequal line voltages cause differing currents to flow in the diode rectifiers, resulting in unequal diode heating. For a constant power, the diodes with the higher voltages end up heating more than the rest, and eventually the controller will nuisance trip due to excessive diode temperature. When the system cools, the motor operates normally until the unbalance is enough to overheat a diode again.
It doesn’t take much unbalance to cause problems. The currents in Figures 2 and 3 actually show a noticeable unbalance, ideally each current pulse would be equal in height. The voltage unbalance is only 0.4% here, but the current unbalance is much higher. The nonlinear nature of the VFD can produce current unbalance up to 20 times larger than the incoming voltage unbalance. As the unbalance increases, the 3rd harmonic current appears, an indication that the unbalance may be creeping too high.
Recommended Monitor Settings
The primary data types useful for VFD troubleshooting are stripcharts and waveform capture. The optimal monitor setup depends on whether the goal is to measure PQ problems experienced by the VFD, caused by the VFD, or both. For problems experienced by the VFD, voltage must be recorded, but current isn’t absolutely required, although helpful. Connect the recorder in the same configuration as the VFD – e.g. if the VFD is wired as a delta, connect the recorder as a delta. Be sure to record RMS and THD stripcharts at least. Voltage unbalance is calculated by ProVision from the RMS voltage stripchart, so no extra setup is needed for that. For waveform capture, the goal is to capture sags that may interfere with the motor, so settings should be focused on RMS voltage triggering rather than waveshape or current thresholds. To maximize waveform capture memory, disable any unused channels (e.g. channel four on a four channel recorder), and consider reducing the sampling rate to 128 samples per cycle – plenty for sags. Event capture is also useful for sag detection – here, set the nominal voltage to the system nominal.
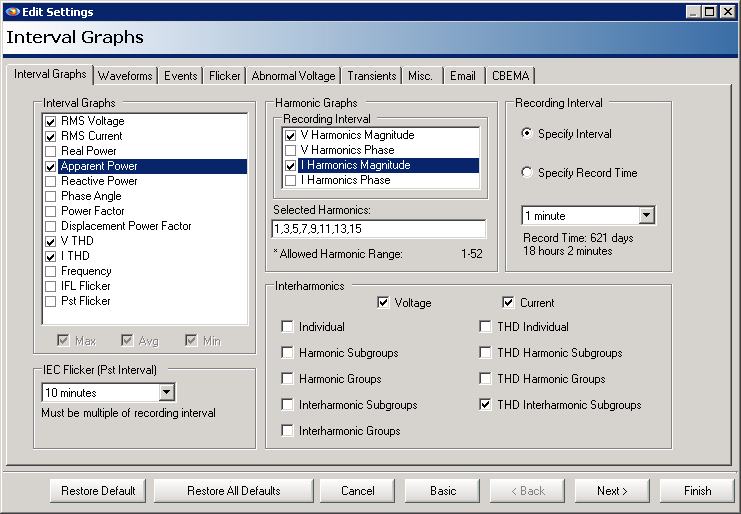
For measuring PQ problems caused by VFDs, harmonics and current are required. Make sure the current range on the CTs is set correctly for the actual VFD current, to avoid clipping if the range is too low, or low resolution if the range is too high. For harmonics, the odds from the 3rd through the 13th are useful, which includes three triplens (3, 9, 15) that should be zero, and two pairs of non-triplens (5 and 7, 11 and 13). Enable these for voltage and current magnitudes. The Revolution can measure interharmonics, and since VFDs can cause interharmonic issues, enable “THD Interharmonic Subgroups” to see if there are interharmonics present. These stripchart settings are shown in Figure 7.
For waveform capture, it’s good to have a capture while the VFD is running. If the motor is running most of the time, a periodic waveform capture could be useful to get a “normal” snapshot. Due to the slow ramp-up period of many VFDs, triggering a waveform capture on the actual motor start may be difficult, unless it’s the only load being monitored.
The specific settings for waveform capture depend on the situation, but a starting point is shown in Figure 8. Here the voltage percent threshold is bumped up to 6%, to lessen the sensitivity to sags, and the absolute voltage trigger set to 100V, to prevent that from triggering at all (here the goal is to capture PQ waveforms caused by the VFD, not necessarily those that would upset the VFD itself). The current threshold is set at 10% of the CT full scale to capture a waveform at the VFD startup. This threshold operates on the difference from one cycle to the next, so on the 1000A range, a 100 amp change from one cycle to the next would be required to trigger. Set this percentage appropriately depending on the actual motor current. If the motor isn’t the only load seen by the CTs, it may be better to leave the default value of 40%, to avoid triggering on other loads and needlessly triggering extra waveforms.
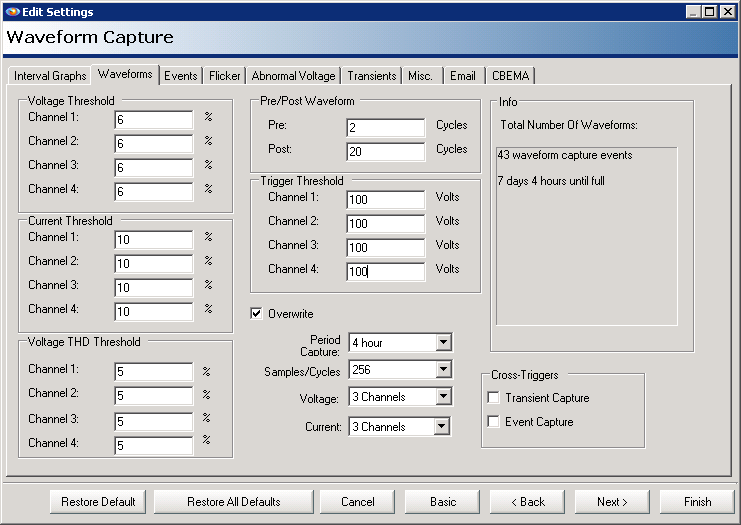
The Post cycle value has been increased to 20 to help capture the entire VFD startup. The voltage and current channels are reduced to three for maximum use of waveform memory, and the periodic capture is set to four hours – adjust this depending on the duration of the recording session. With these settings, the recorder will start overwriting older waveforms after one week just from periodic captures.
In any case, the stripchart interval should be set taking into account the duration of the recording session and the frequency of motor stop/starts. If you’re on-site for a short recording and can stop and start the motor at will, set the interval for 1 second for maximum resolution. Although the 1 cycle interval is often used for regular motor studies, with VFDs it may not be a good choice – no harmonic stripcharts are recorded with a 1 cycle interval, and for VFDs harmonic recording is much more important than 1 cycle RMS values. This is especially true given the low inrush/startup current of a VFD.
For a longer recording, it’s helpful if the stripchart interval is smaller than the typically on/off cycle of the motor. For example, if the motor switches off and on every 15 minutes on average, use at least a 5 minute interval, or even better, 1 minute. This gives plenty of time resolution in the stripchart relative to the speed of the equipment operation.
Conclusion
VFDs have several advantages compared to traditional motors, but present some PQ challenges. More sophisticated monitoring, including unbalance and harmonic analysis is needed to quantify PQ problems caused by VFDs, and those that affect them. Recommendations are presented here as a starting point for VFD investigations.
