Abstract
Voltage unbalance can cause severe heating in motors and large DC power converters and an increase in harmonic currents. Fortunately unbalance is easy to measure with PMI recorders and ProVision – only standard RMS voltage stripchart data is required from the recorder.
Ideally the voltages of a polyphase system are all equal in magnitude. Due to uneven single-phase loading, differences in impedance in connectors, transformations through open delta and other non-symmetric transformer arrangements, and other factors, the line voltages are often not exactly equal as delivered to a load. Small differences in voltage are usually harmless, but as the difference increases, problems can quickly develop.
Voltage unbalance in a three-phase system can be defined as the max deviation from the 3-phase average, divided by the average. Defining Vave as the average of the 3 line voltages V1, V2, and V3, and max deviation dVmax as the maximum difference from the average:
results in this expression for the voltage unbalance:
For example, if the three line voltages are 124V, 119V, and 112V, Vave is (124+119+112)/3 = 118.3V, dVmax is |112-118.3| = 6.3V, and Vu is 100(6.3/118.3) = 5.33% at that point.
Voltage unbalance can be especially damaging to motors. A difference in phase voltages causes circulating currents in three-phase motors, with a resulting current unbalance of up to 6 to 10 times higher than the voltage unbalance. The extra current contributes to increased motor heating, and can be severe with a large unbalance. The temperature rise is proportional to the square of the voltage unbalance, and the increase from ambient temperature can be doubled with a 7% voltage unbalance. Increased temperature degrades insulation and decreases the motor life.
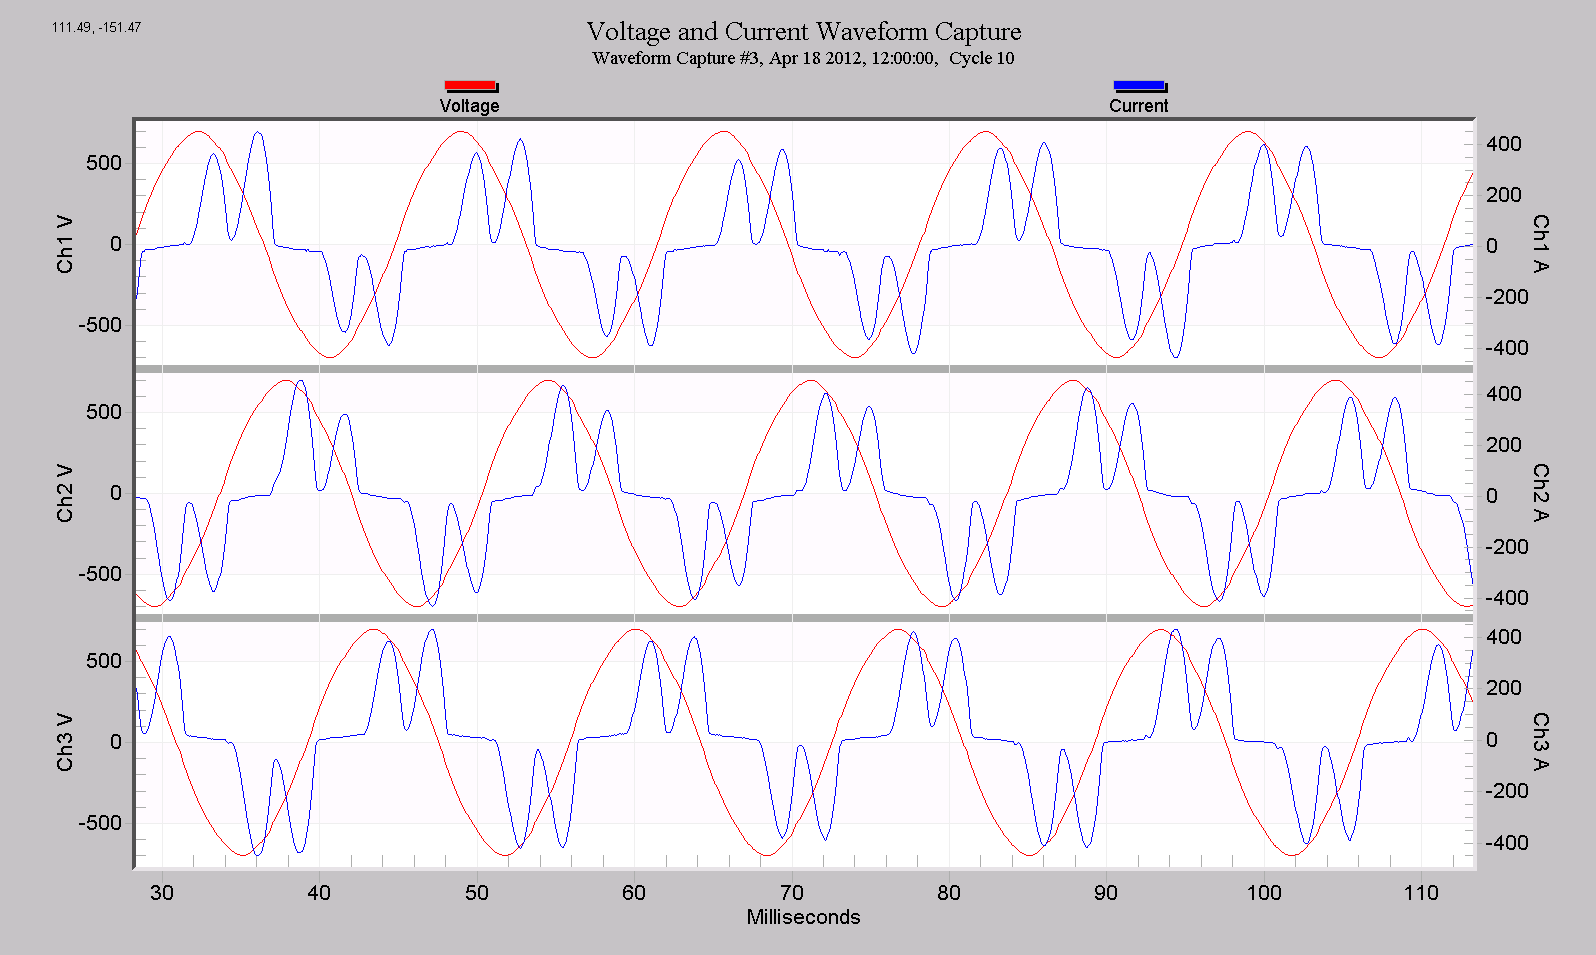
Voltage unbalance can also cause problems for 3-phase DC converters (often used with adjustable- and variable-speed drives controllers). The front-end is usually an arrangement of high power diodes, followed by large capacitors. The current is drawn in pulses, with 6 pulses total through a single 360° conduction angle (Figure 1). Ideally the size of each current pulse is roughly the same, but voltage unbalance causes some to be larger, and some smaller. In Figure 1, the 1st pulse in Phase A is lower, while Phase B’s 1st pulse is higher; this reverses for the 2nd pulse. Since each pulse is conducted by a different diode, power is not divided evenly among all diodes, leading to overheating. The differing pulse heights are also responsible for an increase in harmonics. An ideal 6-pulse converter has no triplen harmonics (e.g. 3rd, 9th, etc.). As the pulse becomes more unequal, the triplen current harmonics grow. Since triplen harmonics don’t cancel in a neutral conductor, this can lead to increased neutral current, in addition to increased transformer harmonic loading. The voltage unbalance in Figure 1 is less than 0.4%, but still very noticeable in the current waveform.
Since a major source of problems from unbalance is motor overheating, it’s usually best to connect the recorder to match the motor hookup. Since most 3 phase motors are wired as a delta, the monitor should also be connected and configured with a delta hookup, so phase voltages are measured, instead of line voltages. The line voltage unbalance isn’t necessarily equal to the phase voltage reading, due to possible phase angle differences.
A typical unbalance reading is under 1%. ANSI C84.1 recommends keeping voltage unbalance below 3% (as measured at a revenue meter), and many utilities target 2 or 2.5% as a maximum, where possible. Manufacturers are more strict – NEMA MG-1-1998 requires motors to be rated for up to 1% voltage unbalance, which is less than many utility standards. Motors may be derated for use at high unbalance levels; IEEE Std. 141-1993 gives a derating graph for values over 1%.
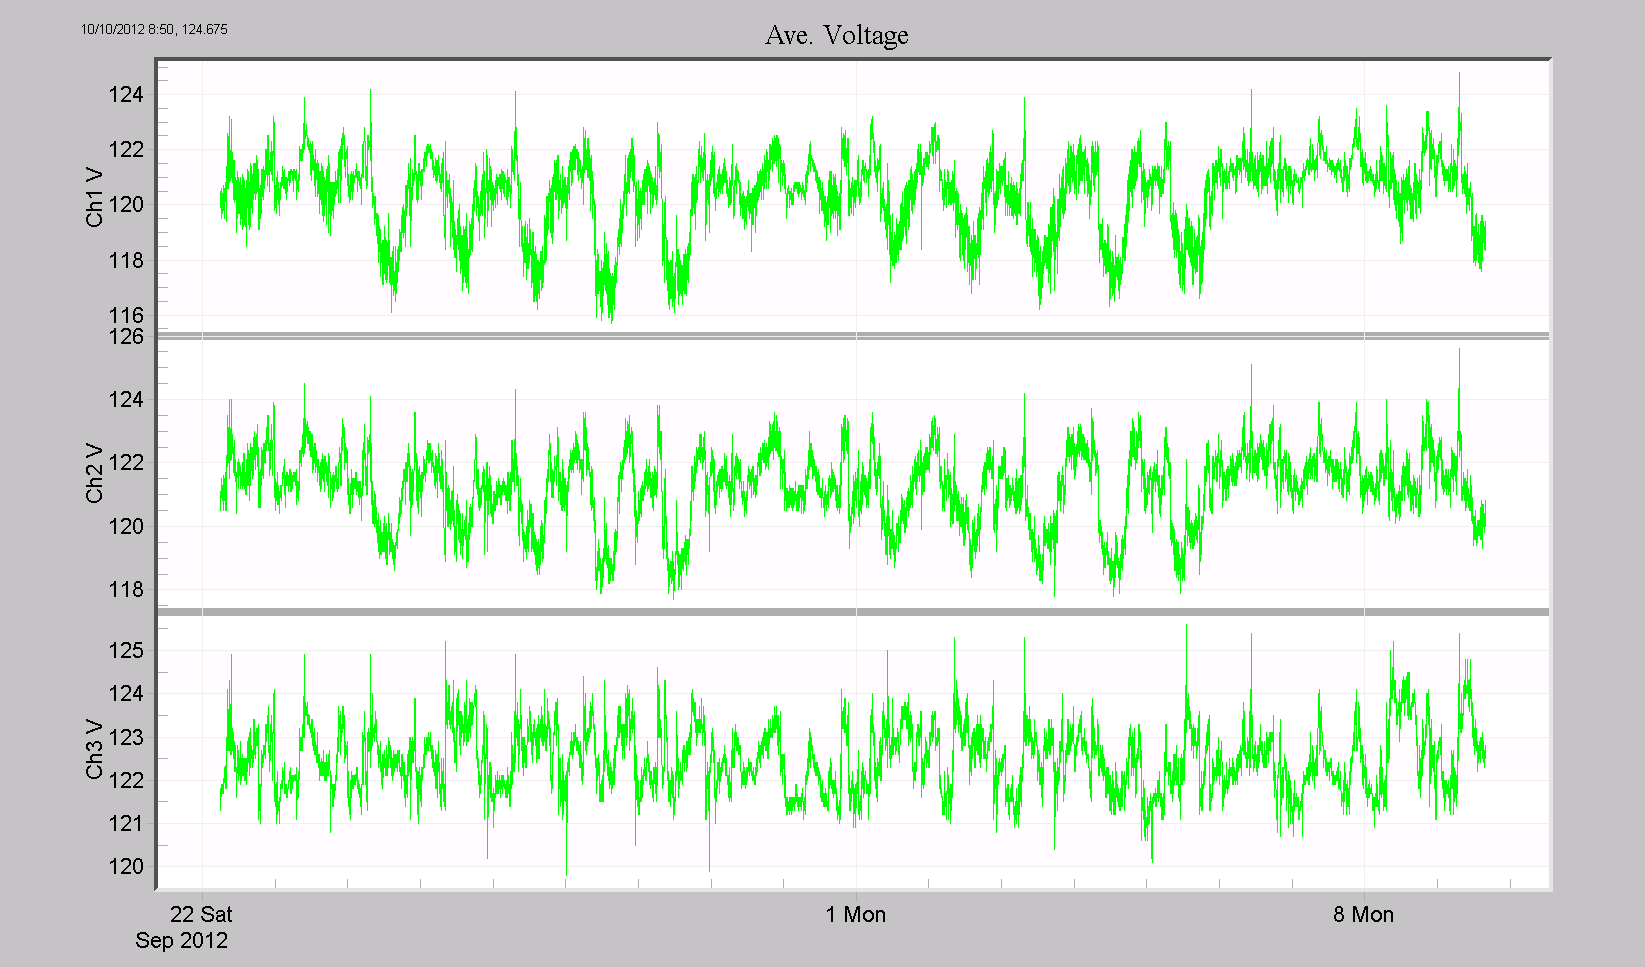
ProVision computes voltage and current unbalance from the basic RMS voltage and current interval data logged by all PMI recorders. As long as the RMS voltage stripchart is recorded, the voltage unbalance can be computed and graphed – no extra data is needed. For each interval, ProVision uses the average voltage value for each phase (as opposed to the min or max value, Figure 2) to compute the 3 phase average Vave, and dVmax, to then compute Vu. This is repeated for each point in the interval data, resulting in a graph of voltage unbalance. The voltage unbalance is also used to generate a current unbalance graph. Voltage and current unbalance is also available as a text report, and may be mixed with other interval graph data.
To view the unbalance graph, choose Graph, RMS Interval, Voltage and Current Unbalance (Figure 3).
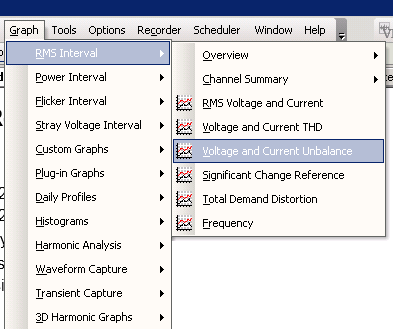
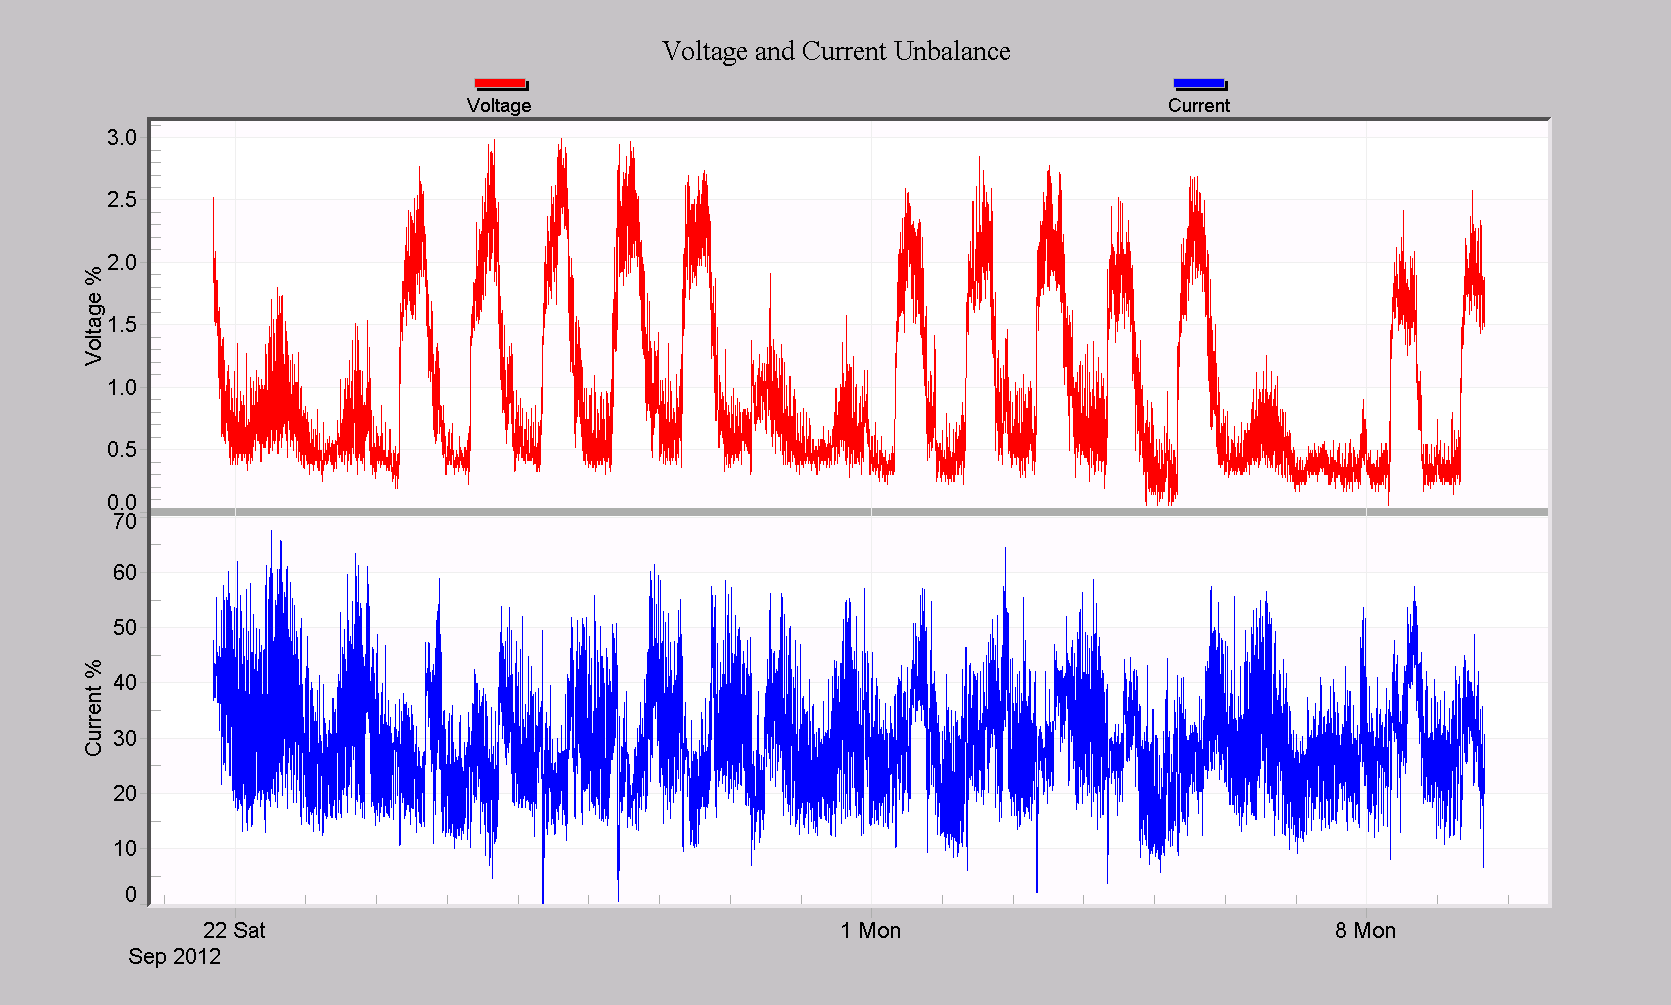
Figure 4 shows the unbalance graph from a recording session at the PMI headquarters. We see that the voltage unbalance ranges from about 0.5% to almost 3%.
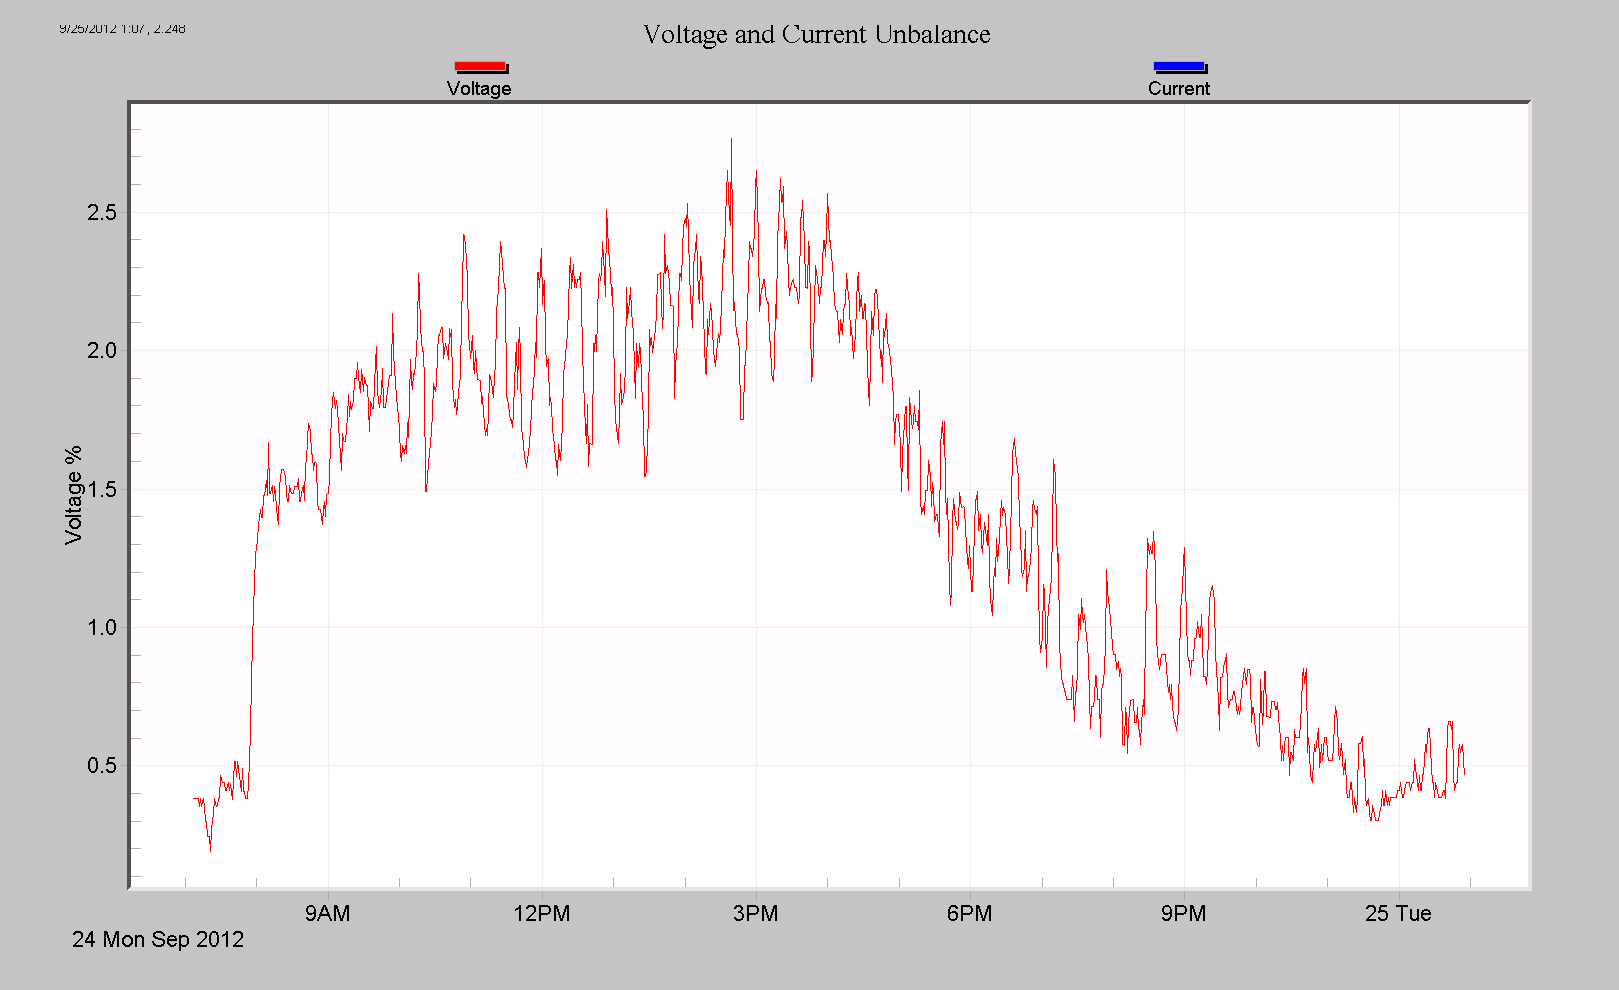
Zooming in on a single day (Figure 5), it’s clear that the unbalance is directly related to daily loading. The loading at this location is not very balanced, with many single phase loads not distributed evenly among phases. From Figure 5, it appears that loads appear very quickly around 8am, with a much more gradual return to nighttime conditions from 5pm to 10pm.
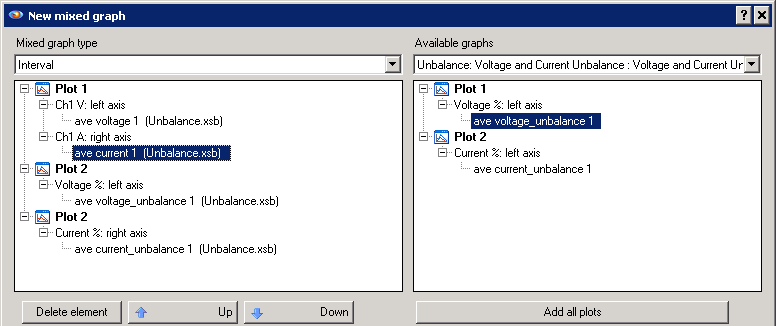
To make the relationship between RMS voltage, current, and unbalance easier to see, use a mixed graph to show them on the same plot. Figure 6 shows a mixed graph definition created with one plot showing phase A voltage and current, and a second plot with voltage and current unbalance.
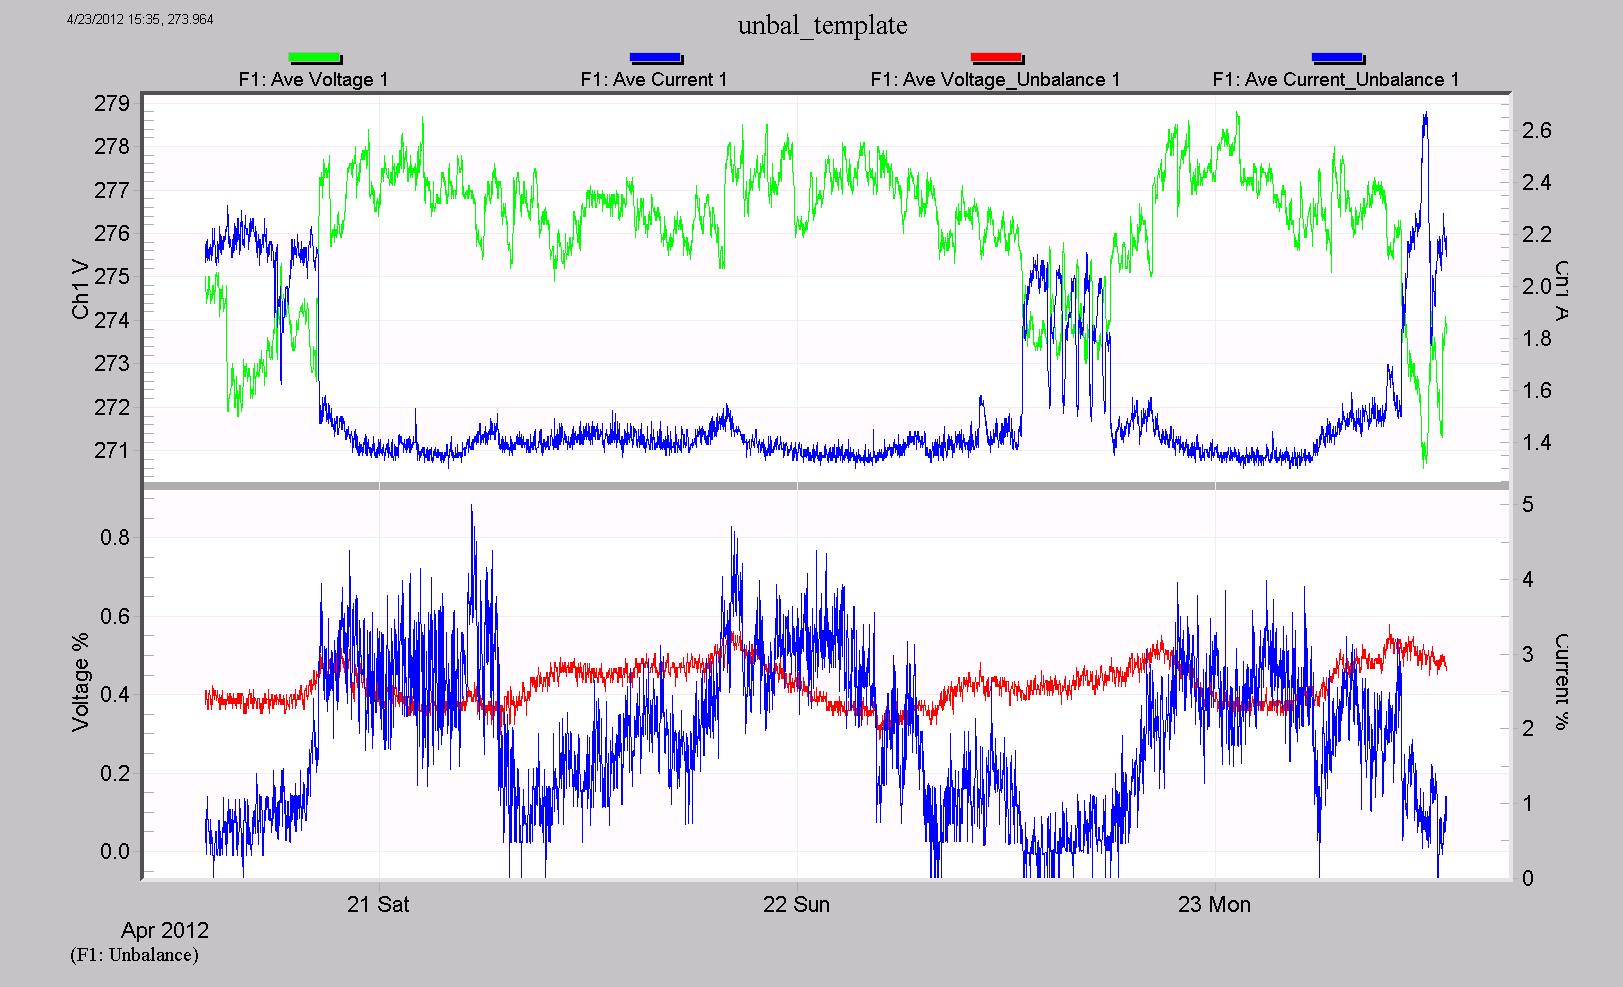
The resulting graph (Figure 7) shows how the voltage sags due to load current, and also the voltage unbalance varies with load current and current unbalance, all at once. In this case, the voltage sags about 1.4% under load, and it appears that the voltage unbalance is not strongly related to load or load balance – the voltage unbalance (red trace in the bottom plot) doesn’t change in response to changes in current (top blue trace) or current unbalance (bottom blue trace). The 0.4% voltage unbalance is likely coming in from the distribution system, rather than being generated from the monitored load.
Conclusion
Voltage unbalance is an important parameter to check when analyzing any 3-phase data set. Since the unbalance data is computed by ProVision from regular RMS voltage interval data, it’s always available in any PMI recording, and is quick to review. Older files from previous-generation recorders may also be loaded into ProVision for historical comparisons. If you see values approaching 1%, it’s worth noting, and anything above 3% could be a cause for concern or further action.
