Abstract
Having access to calculated Total Demand Distortion data rather than just Total Harmonic Distortion data makes it possible for the actual load on a system to be compared against the maximum load, preventing the end-user from being unfairly penalized when the load is lighter than the maximum. This white paper provides an overview and demonstration of creating and using the Total Demand Distortion report and graph, a feature that is available in ProVision 1.61 and subsequent releases.
Total Demand Distortion
Total Demand Distortion (TDD) is defined as the ratio of root-sum-square value of the harmonic current to the maximum demand load current. The harmonic current data are stored in the recording file itself. However, since the maximum demand load current is a variable that can’t be measured, it must be specified instead. This specification occurs as part of the procedure for creating the TDD report and graph.
Note that at maximum load, the Total Demand Distortion and the Total Harmonic Distortion will be the same. Therefore, as the specified load drops, the relative values of the TDD data to the corresponding THD will fall as well. The THD values may initially appear high. Since Total Demand Distortion is calculated using actual current as opposed to the THD values– which will potentially never be reached, a high THD value may never actually be problematic. Furthermore, THD values can fluctuate with changes in the mix of harmonic vs. non-harmonic loads. TDD on the other hand, is normalized such that pure 60Hz current changes don’t affect the output, so changes in non-harmonic loads don’t cause the TDD value to vary.
TDD Graphs and Reports
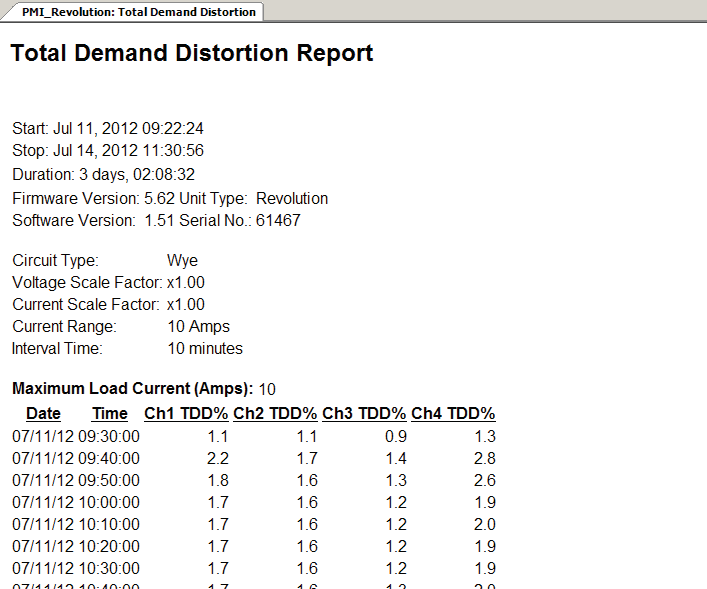
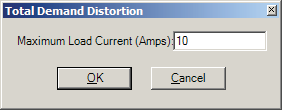
To create either a Total Demand Distortion report or graph, simply select “Total Demand Distortion” from either the report menu or graph menu respectively. This will generate the data for the selected files and present it as the requested report or graph, as shown in Figure 1. Due to how the data are calculated, user input is required. When the initial request for TDD data is made, the maximum load current must be specified in amps, as shown in Figure 2. Note that once the load current is specified, that value is stored in the recording file itself. Therefore, each time TDD data are requested, the default value will be the most recent one specified for that recording.
The recommended value for this, according to IEEE 519, is to use the average current of the maximum demand for the year prior. This can be extrapolated from historical data, but can be adjusted if the load is subject to future changes. ProVision will calculate the TDD data regardless; therefore this value is flexible and allows for multiple reports to be sequentially generated to compare different prospective values.
Note that TDD data are generated from the trace data from the first harmonic and current THD. In the event that the first harmonic is not present, the TDD data points are instead approximated by using the values for RMS current. However, if current THD data are not present, the request for TDD data will fail as there is no way to calculate it. For each data point in the first harmonic (or RMS current value) and current THD trace, the TDD point is calculated via:
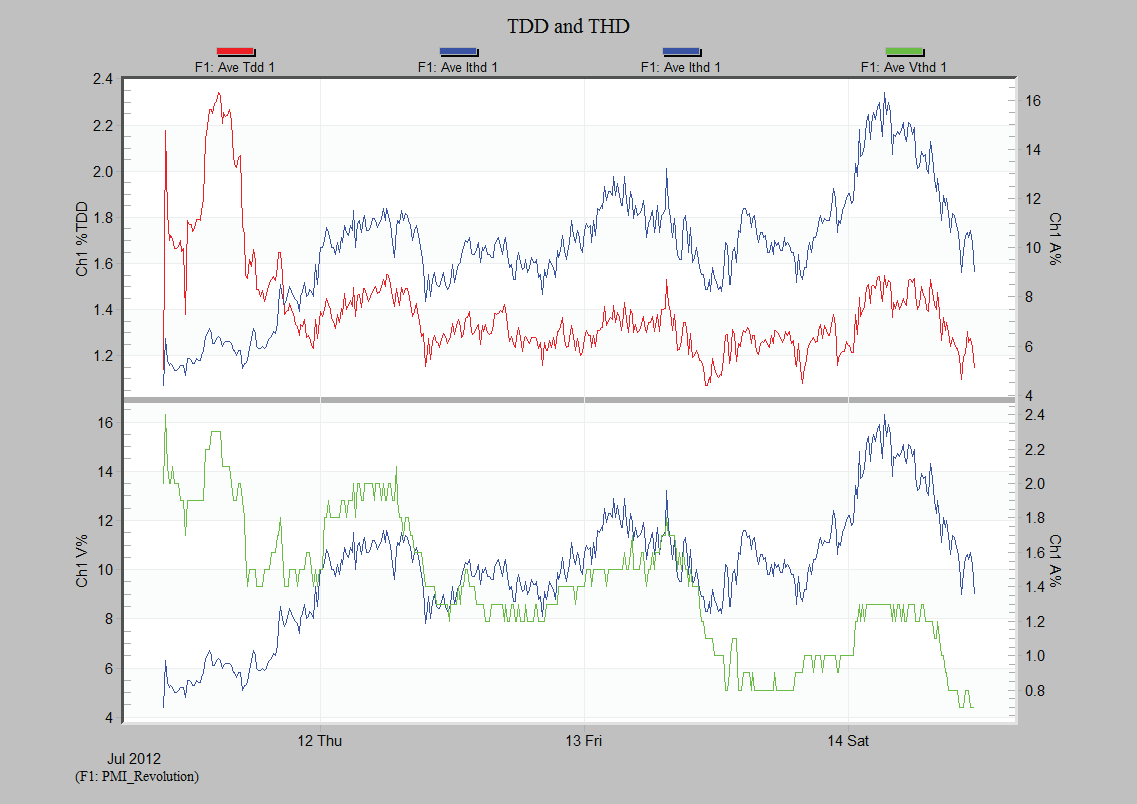
Once the TDD data is calculated, it is either displayed as the requested report or charted as the requested graph. From this point, the resultant report can be exported like any other ProVision report, or the resultant graph can be scrolled, zoomed, and exported to an image as well. Furthermore, since TDD and THD have a correlation, it’s possible to use the mixed graph feature to compare the resultant TDD trace against the original THD trace, as shown in Figure 3, graphing the calculated TDD value against the average current THD.
After the report has been generated, the resultant values can be verified against the standard to ensure none of them are outside the corresponding range. This range varies based on the maximum voltage of the system and the specified load current. The values for systems with voltage levels from 120V to 69,000V are as follows:
| Load | TDD |
|---|---|
| < 20 | 5.0 |
| 20 < 50 | 8.0 |
| 50 < 100 | 12.0 |
| 100 < 1000 | 15.0 |
| > 1000 | 20.0 |
Initializing for TDD
When a recorder is going to record data that will later be used to calculate Total Demand Distortion, it is recommended to initialize the recorder in such a way that all the necessary data will be recorded. To do this, right-click the recorder to initialize in the Device Tree, and from the resultant context menu, select “Initialize”. This produces the Basic Initialization screen as shown in Figure 4. From here, select the “Advanced” button.
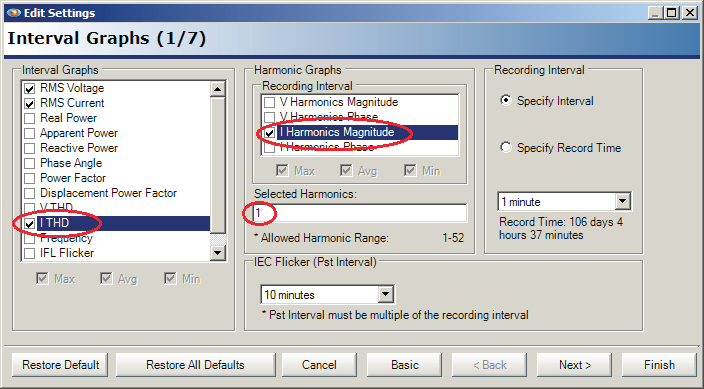
Once on the advanced screen, ensure the checkbox for ITHD under Interval Graphs is checked, that the checkbox for I Harmonics Magnitude under Harmonic Graphs is checked, and that a “1” is entered in the region for Selected Harmonics. The “1” enables the recording of the 1st harmonic (the fundamental). Other harmonics may also be enabled, but at least the 1st harmonic is needed for the most accurate TDD measurement. The other harmonics are included in the THD measurement even if they’re not enabled separately here. This instructs the recorder to record the necessary data to calculate the most accurate TDD traces. If the option for Harmonic Graph is disabled, then the recorder does not support harmonic capture.
In this instance, it will be necessary to configure the recorder for data to approximate the TDD curve. This can be done by ensuring the checkbox for RMS Current is checked, or by using a different recorder that allows harmonic capture. Once the settings have been completed, selecting Finish will result in the prompt to send the new initialization to the recorder. Please note that initializing a recorder will also remove any recording data on it, therefore ensure that the recording has been retrieved or that it is not necessary.
Conclusion
By having access to calculated Total Demand Distortion data opposed to only Total Harmonic Distortion, the actual load on a system can be compared against the maximum load. This prevents a user from being unfairly penalized when the load is lighter than the maximum.
