Abstract
Line frequency is the most tightly controlled parameter in the electrical distribution system. Since almost all generation in a region is connected essentially in parallel, the frequency is inherently synchronized through most utilities. Most generators increase or decrease their power with slight changes in frequency (speed up the generator for more power, slow it down for less), so on a system-wide scale, generators are adjusting to real-time changes in aggregate load by slightly adjusting their frequency, in a coordinated and distributed fashion. Consequently, measuring line frequency during a PQ investigation or for routine monitoring is not often required. For those times when it is required, it’s important to understand how frequency is characterized and displayed in PMI recorders.
All PMI recorders that can measure harmonics can also measure and record frequency. This includes the Revolution, Vision, Eagle and Eagle 120, Guardian, and ViP. The method used is identical in each recorder. The channel 1 voltage fundamental (1st harmonic = 60Hz) value is computed, including the magnitude and phase angle, each cycle. The phase angle value feeds into a low-pass filter and is used as part of a software phase lock loop system that adjusts the recorder sampling in real-time to stay synchronized to the power line. The small phase angle deviations that feed into the loop are proportional changes in the line frequency, and are averaged and converted to frequency units once per second. This gives a smoothed frequency update each second; this value feeds into the stripchart min/max/average logging system. For example, with a one minute stripchart interval, the min and max one-second values will be stored each minute, along with the average value over that minute. In the stripchart data, frequency is only recorded for channel 1 – the other channels will have no frequency information.
The frequency measurement (and overall sampling synchronization system) is based on the channel 1 voltage input. For PMI recorders, channel 1 is also the power supply input, so it’s virtually certain to be generally present during the recording. During an outage, the recorder “free runs” at the last frequency value, and resynchronizes when power returns. PMI recorders will automatically synchronize to any frequency between 45 and 72 Hz, although in most situations the line frequency will either be 50 or 60 Hz.
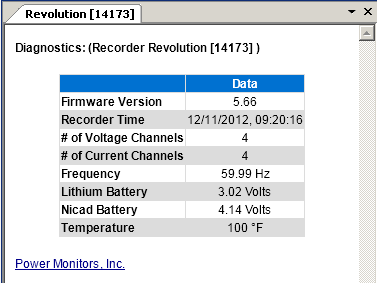
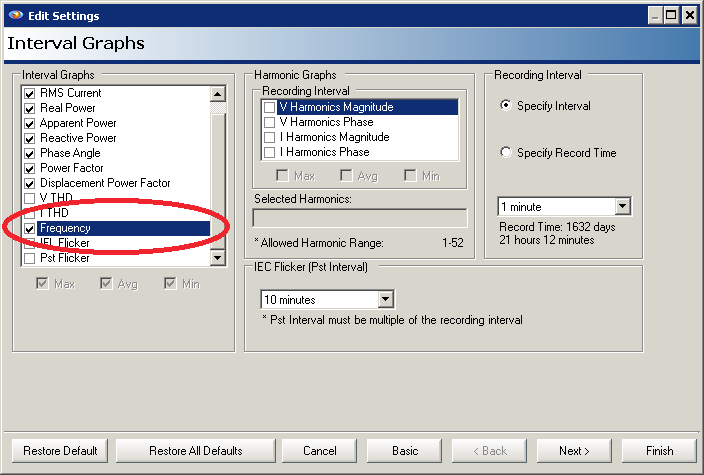
Frequency can be viewed in real time in ProVision with a connected recorder by choosing Recorder, Meter Display, Diagnostics (Figure 1). The value shown is the one-second average. To record frequency, enable the frequency interval graph on the first page of the Settings Wizard (Figure 2). This enables frequency min/max/average logging on channel 1, at the selected interval period. Since frequency is only recorded for one channel, the memory usage is less than for other measurement types (e.g. RMS voltage).
To view the frequency interval graph, choose Graph, RMS Interval, Frequency in ProVision. Figure 3 shows a frequency graph, with the Min, Ave, and Max traces on separate plots. This recording is from the Revolution calibration/test fixture, where the frequency is adjusted in 2 Hz increments from 48 Hz to 62 Hz.
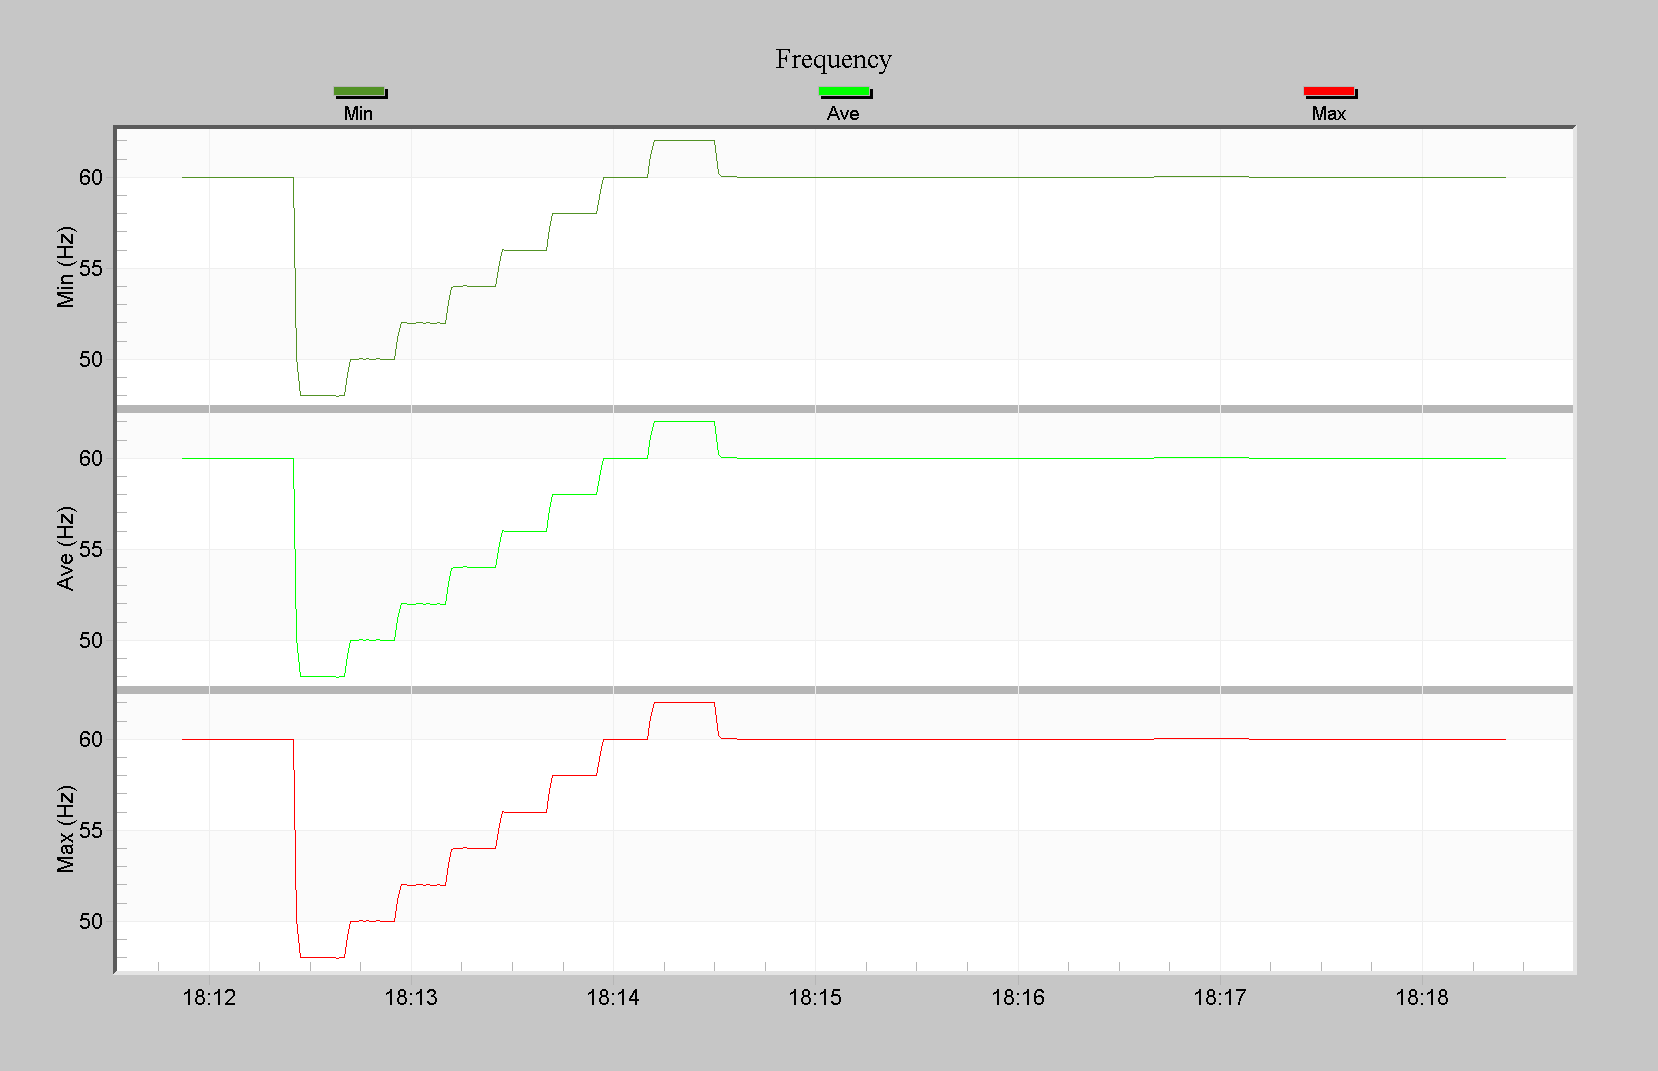
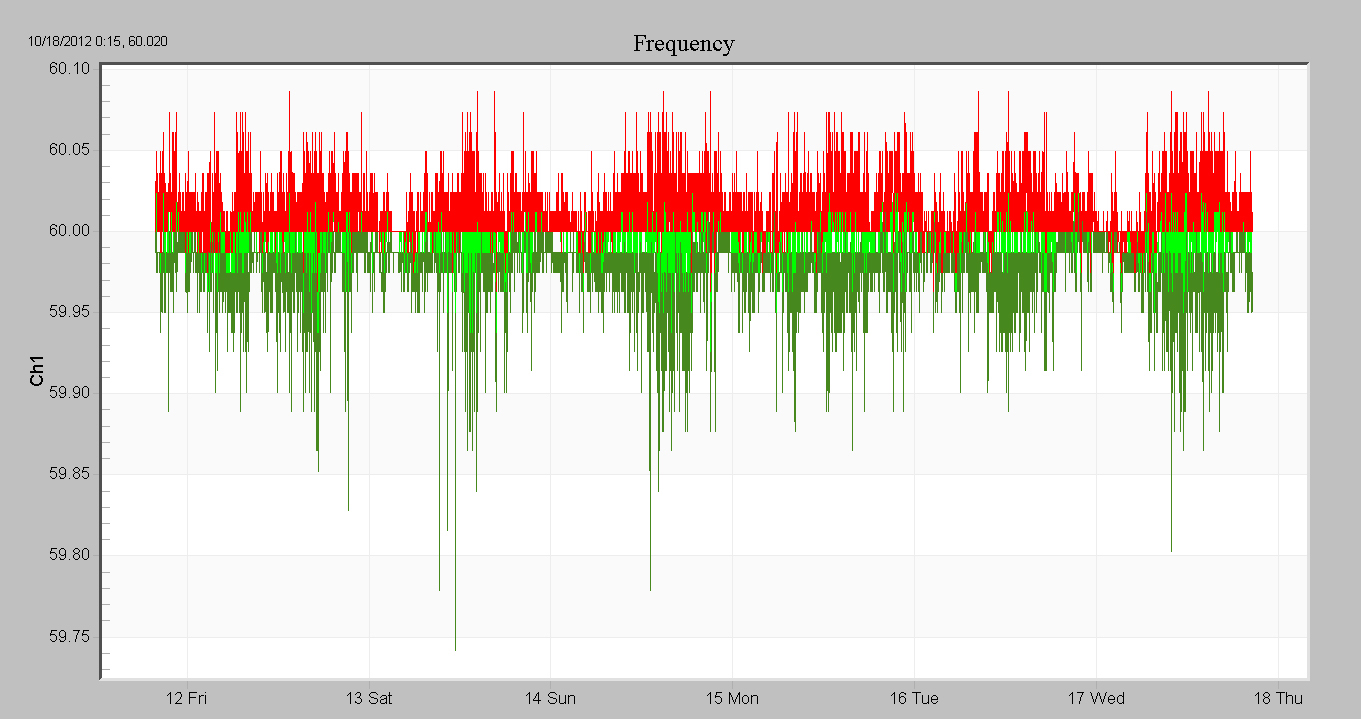
Figure 4 shows the frequency graph at a motor control center over a 6 day period, with a 1 minute average. Although all the values are close to 60.00Hz, there is some structure present. The min and max traces (top, dark green and bottom, red respectively) show larger deviations from 60.00Hz during the day, and very few during the evening. Although some of these excursions are due to the actual line frequency shifting, a significant portion is due to local loads causing phase shifts in the voltage. An electrically “large” step change in load (relative to the capacity of the system) can cause a step change in voltage absolute phase angle, due to the network inductance and load impedance change. A shift in phase is mathematically equivalent to a short-term change in frequency, and produces small excursions in the minimum or maximum frequency readings in an interval. In this recording, the loads are switching much more often during the day, causing more deviation from 60.00Hz in the min and max readings.
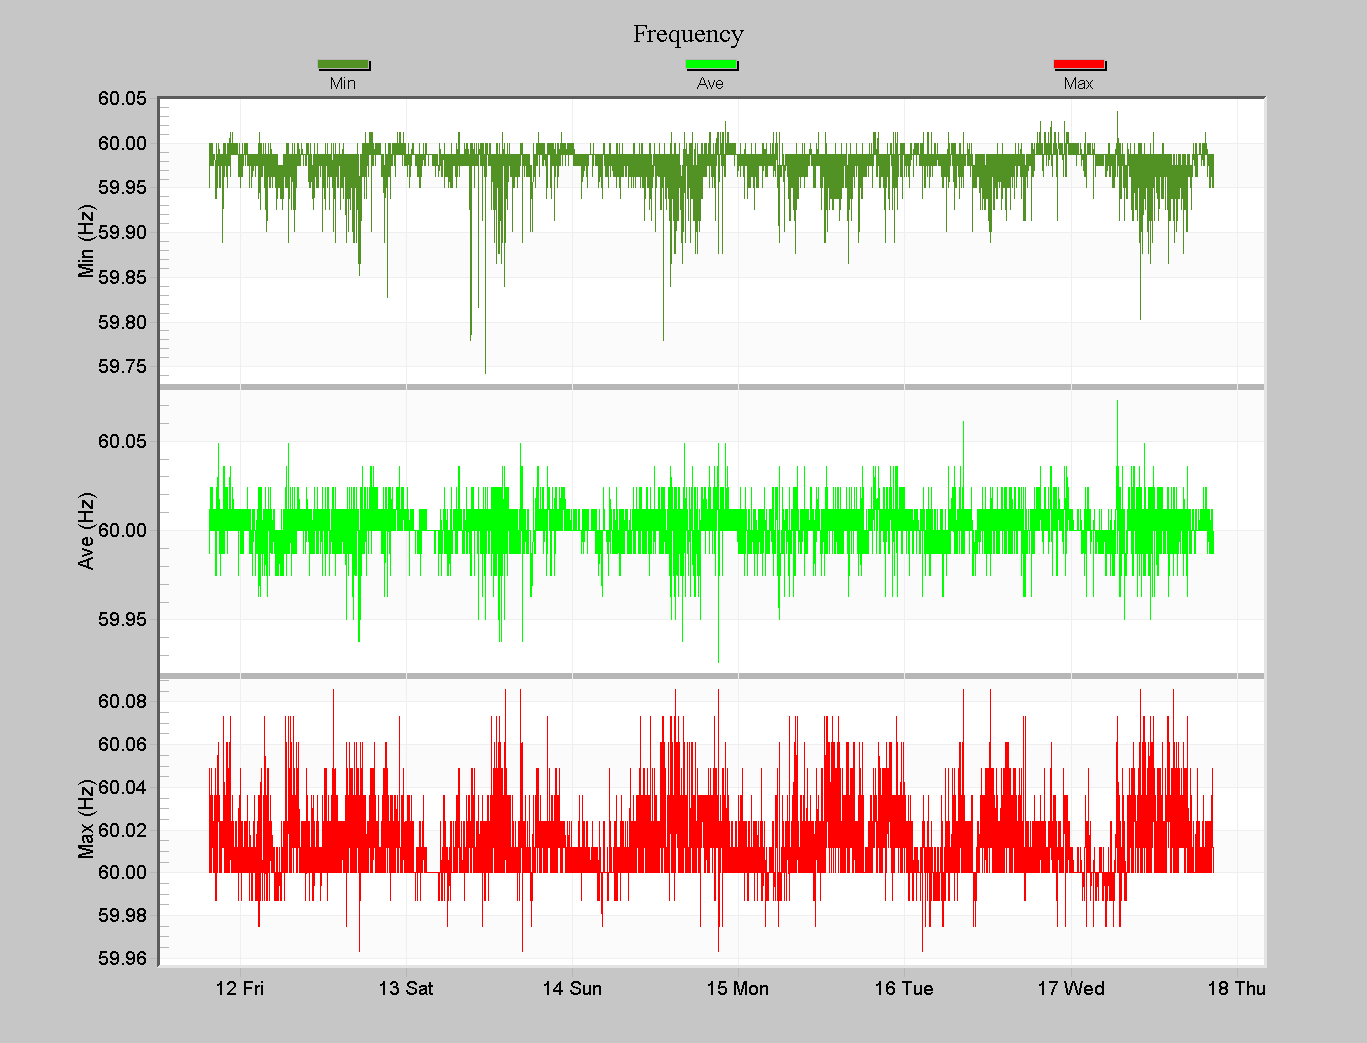
The average trace (center, green) is a series of one minute averages, and most locally caused deviations are averaged out. There is still a small daily variation, but this is more likely due to true line frequency movement. Figure 5 shows the same traces on a single plot (created using a custom graph). In this view, it’s easier to see the relative size of the min/max vs. average deviations.
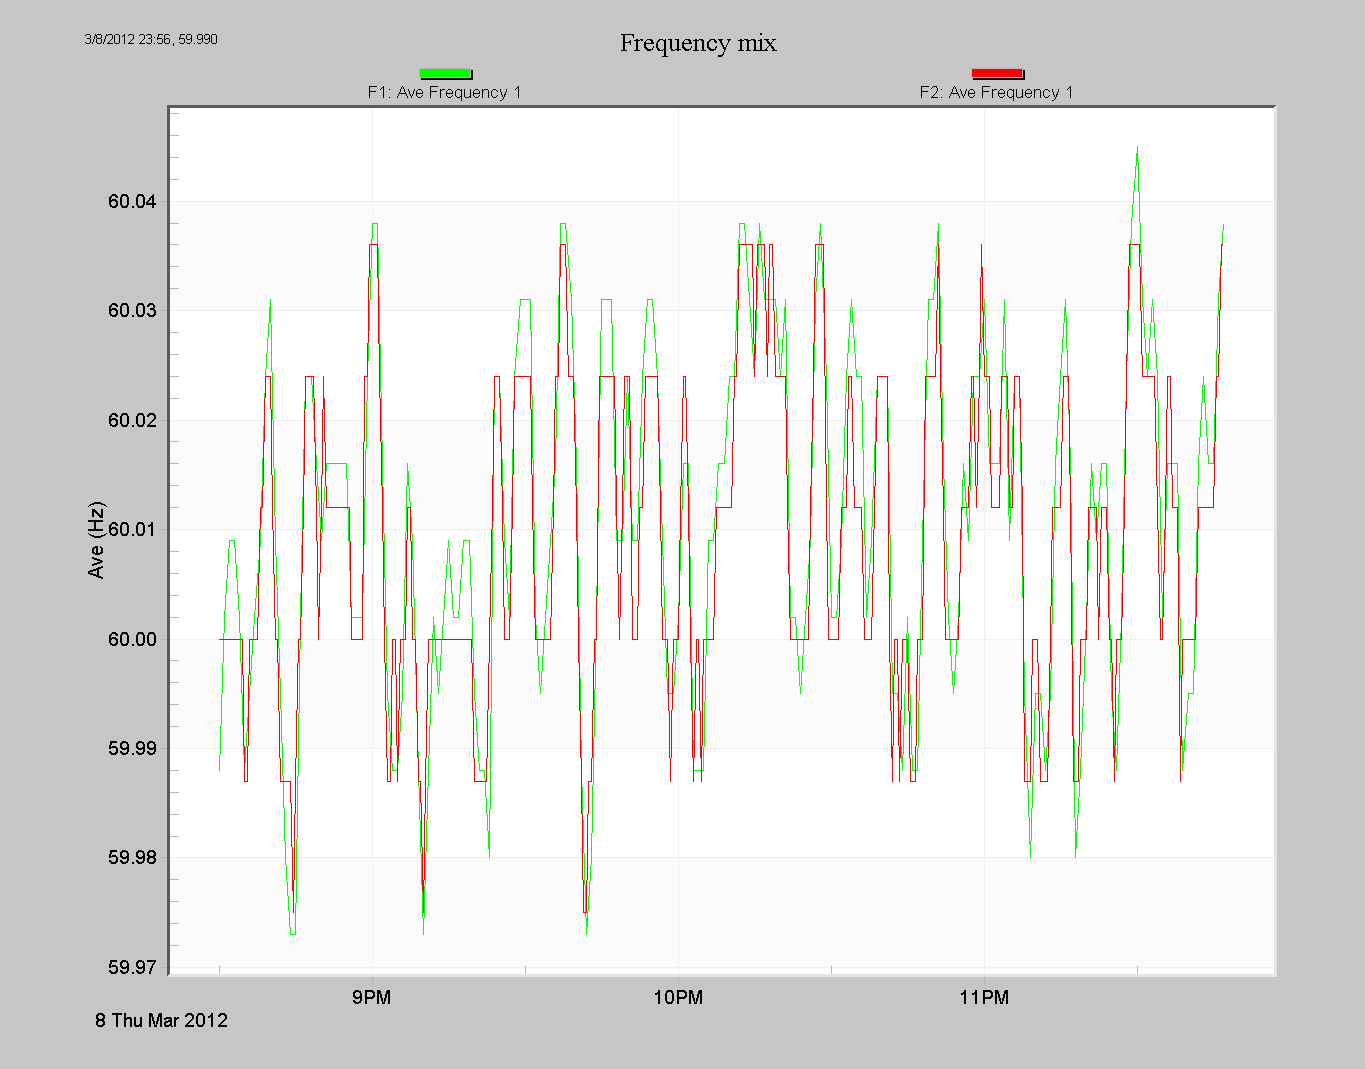
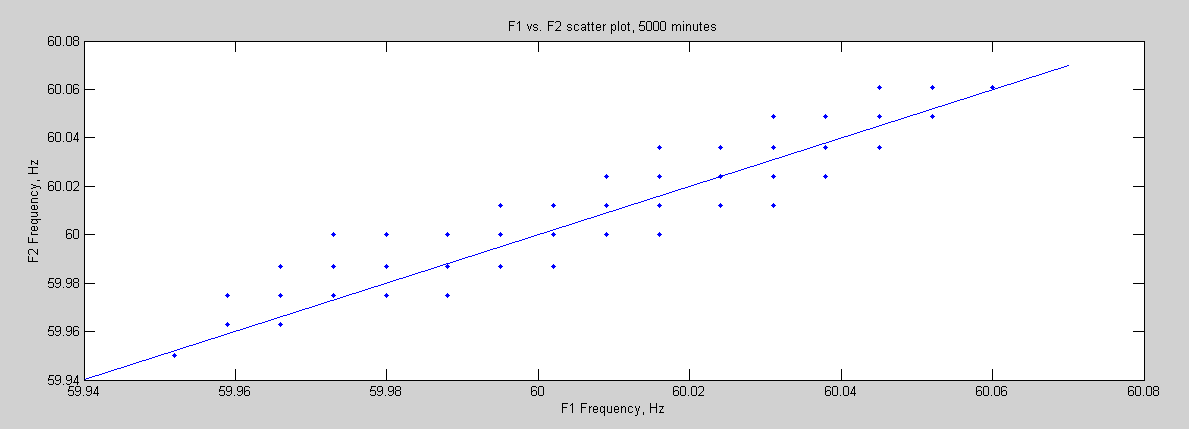
In Figure 6, frequency traces are shown from two different recorders. Both are average traces, one with a one minute interval (file F1), the other with a 30 second interval (file F2). F1 was recorded with a Revolution in Virginia, and F2 was recorded with an Eagle 330 in Florida, both during March of 2012. A portion of March 8th is shown, and the average frequency tracks very well between the two. Generally the difference is under 0.005Hz, and most changes are nearly identical. To confirm the similarity, the raw data was exported from ProVision and used to create a scatter plot (Figure 7). Here over four days of overlapping frequency points were plotted, with one file plotted against the other. A 1:1 reference line is drawn, indicating the theoretical ideal match. The actual scatter points follow the line well, with a correlation of 0.90 – pretty close for two recordings over 1000 miles apart. The min and max traces would not show as strong a correlation, due to local load changes.
The example above would suggest that there’s no real need to monitor frequency, or at most, it could be monitored at just one location – if it’s essentially the same in two places 1000 miles apart, why not? Frequency monitoring is important where the AC power is not supplied by or synchronized to the larger distribution grid. Traditionally, backup generators, motor-gen sets (e.g. single-phase to 3 phase motor-generator converters), and battery-powered UPS sources were the primary suppliers of non-synchronized power. Generators in particular are often not well regulated for frequency, and often vary with load. Good UPSs and electronic inverters synthesize AC waveforms with a crystal-controlled frequency reference, which should be very stable. Cheap inverters may not use a crystal reference, and these can exhibit frequency drift with temperature or time.
Conclusion
As microgrids and distributed generation proliferate, islands of isolated power will become more numerous, increasing the need for frequency monitoring.
