Voltage Regulation Basics
Utilities are generally required to ensure the delivered steady-state voltage is within the limits specified in ANSI C84.1. Persistent under- or over-voltage can result in customer complaints of frequent blown light bulbs, overheated motors, and equipment damage. Generally speaking, ANSI C84.1 specifies limits of 5% above and 5% below the voltage nominal at the service entrance. For example, with a 120V nominal, these limits would be 126V and 114V, respectively. Another standard of note is ITIC (formerly CBEMA) standard, intended to be a performance-oriented standard for electronics equipment manufacturers. ITIC specifies more lax limits of 10% above and below the nominal voltage in the case of steady-state voltages.
The Problem
Whether voltage is within or outside of the specified limits of either standard, one challenge is relaying this information to the customer in a visual, comprehensible, and intuitive way. This paper will discuss how to do this using a Revolution or Guardian recorder, and PMI’s ProVision software to do just that.
Recording
In order to analyze for voltage regulation effectively, set your recorder to record the RMS Voltage and RMS Current. Strictly speaking, only RMS voltage is needed to check voltage regulation, but having the current data allows for determining if the local load is a cause of voltage swings, or merely affected by them.
If the customer has local grid-tied generation, such as solar panels or a wind turbine, you should also include Real Power in your recording. This will allow you to measure the power flow into the grid, and help quantify its effects on the system voltage.
Analysis
Once you have downloaded and opened the recording with ProVision, you will need to create a single-plot RMS Interval graph. To simplify this task, we have provided the following graph template for download: Voltage Regulation – 120V Nominal.
This template is simplified to only show average RMS voltage for the recording interval, leaving off the 1-cycle min and max values. For voltage regulation, short voltage sags and swells are not pertinent – these types of problems are distinct from steady-state RMS voltage issues.
Download this template, and open it in ProVision. The template will appear in your Explorer panel, in the Graphs and Reports section. Double-click the template to begin. You will be prompted to select an open recording to graph. The template is configured for a 120V nominal. Both RMS Voltage and RMS Current are visible for analysis. RMS Voltage, on the right y-axis, is fixed to a scale of 110V – 130V. This allows the graph to encompass both the +5% (126V) and -5% (114V) limits of the ANSI C84.1 standard. The left y-axis is auto-scaled RMS Current.
You can quickly adjust this graph for other nominals, by clicking Tools > Axis Bounds, and selecting the first axis “RMS Voltage (AVE)”. Enter values which encompass the 5% +/- limits of the standard, based on your nominal. For example, if your nominal voltage is 277V, your limits are 263.2V – 290.9V, so enter 260.00 and 295.00 as your min and max values, respectively (Table 1 for suggested bounds for other nominals). This will give you some space above and below the limits in your graph (Figure 1).
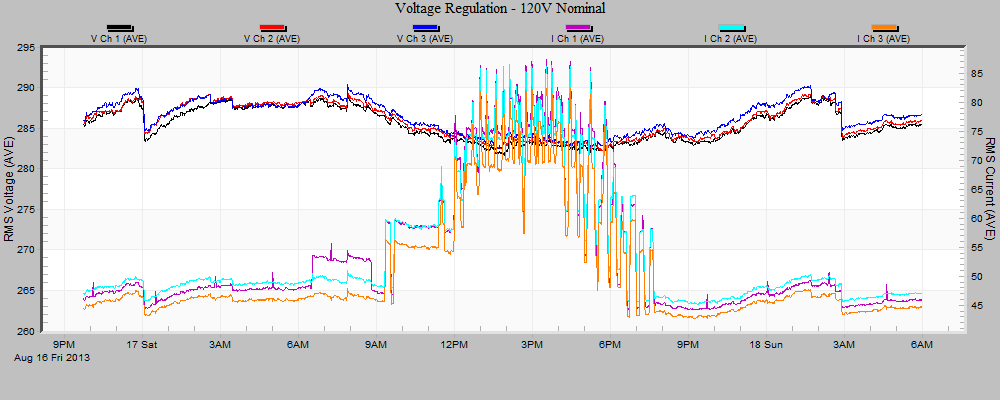
A strong inverse correlation between voltage and current in this graph indicates that any out-of-bounds voltages are most likely due to local load causing excessive voltage drop. This could be a loose connection, undersized transformer, or service drop conductors. Conversely, the absence of such a correlation indicates the problem lies upstream.
| Nominal | Min Voltage (-5%) | Max Voltage (+5%) | Axis Min | Axis Max |
|---|---|---|---|---|
| 120V | 114.0V | 126.0V | 110 | 130 |
| 208V | 197.6V | 218.4V | 190 | 225 |
| 240V | 228.0V | 252.0V | 220 | 260 |
| 277V | 263.2V | 290.9V | 260 | 295 |
| 480V | 456.0V | 504.0V | 450 | 510 |
Table 1: Recommended Axis Bounds by Voltage Nominal
Presentation
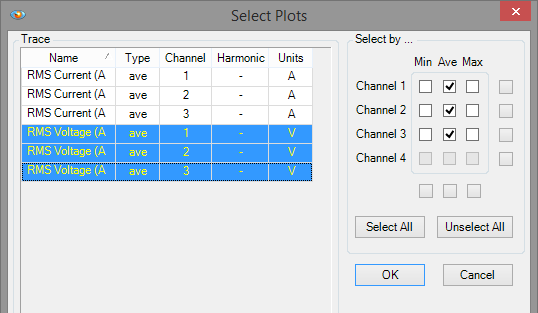
When presenting the results of the voltage regulation analysis to the customer, it is sometimes best to simplify the graph by removing the RMS Current axis entirely. There is no way to remove a y-axis as a whole in ProVision, so we will need to hide the RMS Current traces individually. To do this, go to Tools > Select Plots. While holding down the SHIFT key, click the three RMS Voltage traces to highlight them (see Figure 2), then click OK.
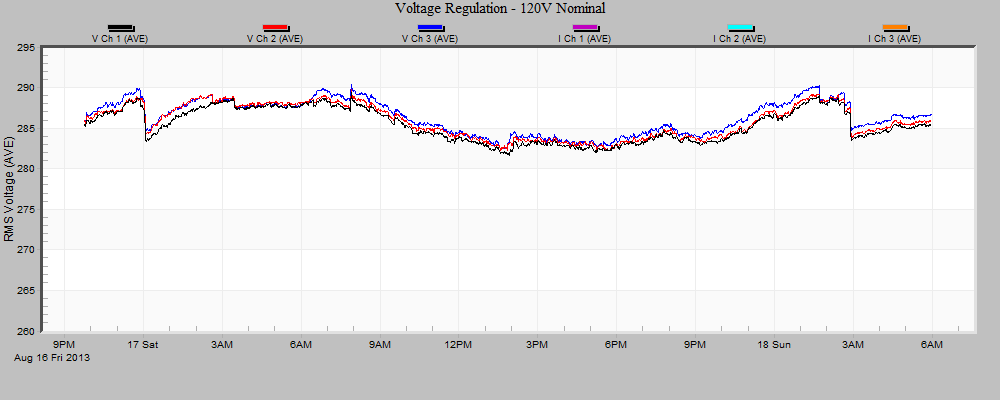
This will remove the y-axis, displaying only the RMS Voltage traces (see Figure 3).
In order to visualize the limits specified in ANSI C84.1 for the customer, we will use the Horizontal Line Annotation tool. The button has a dark green horizontal line and appears one button to the right of the Arrow tool button in the ProVision toolbar. Click this button, and then click somewhere at the top of the graph to insert an annotation. You will note that a black horizontal line has appeared. We need to edit the properties of this line. Click the Properties button at the far right of the ProVision window, and then click the pushpin icon at the top of the Properties pane to “pin” it, or keep it visible.
Now we will edit the properties of the line annotation. Change the Color to “Red”, the Line Type to “Dash”, the Text to “+5% (290.0V)”, and finally the Position to 290.9. You should now have a horizontal line indicating the upper voltage limit of the standard.
Next we will create the lower voltage limit annotation. Once again, click the Horizontal Line Annotation tool button, then click the bottom of the graph. Change the Color to “LimeGreen”, the Line Type to “Dash”, the Text to “-5% (263.3V)”, and the Position to 263.3. Now both the upper and lower voltage limits are visible on the graph (see Figure 4).
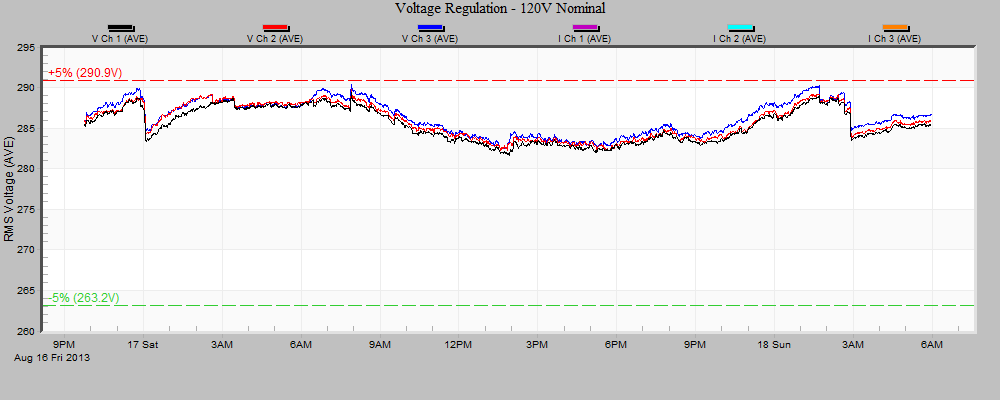
Now we have a graph which clearly visualizes the steady-state voltage. As we can see, the voltage is on the higher-end, coming close to but never exceeding the +5% limit. You can save this graph as an image file by right-clicking the graph, and selecting “Export dialog…”. Change the Export format to PNG and change the Export Destination to “File”. Select a destination folder and filename for your graph.
Simplification
To further simplify this graph for the customer, we can modify the scaling to create a “per-unit” graph, displaying the voltage simply in terms of percentage above and below the nominal, eliminating questions about service voltage.
In order to get a per-unit graph, we will need to change the voltage scale factor for the recording and then regenerate our graph. To change the voltage scale factor, click Tools > Scale Factor. Our goal is to scale our nominal voltage to 100 (100%). Use the scale factor table below (Table 2) to select the correct per-unit scale factor.
| Nominal Voltage | Scale Factor |
|---|---|
| 120V | 0.8000000 |
| 208V | 0.4807690 |
| 240V | 0.4901960 |
| 277V | 0.3610108 |
| 480V | 0.2083333 |
Table 2: Voltage Nominal Scale Factors
Enter the correct scale factor for each channel of voltage, and click “OK.” You’ll notice that this change had no effect on the graph we created previously. We must regenerate the graph using the new scale factor. Double-click the “Voltage Regulation – 120V Nominal” template in the Explorer pane, then select the same recording you’ve been working with.
As with the previous graph, we need to hide the RMS Current traces using Tools > Select Plots. Now adjust the axis bounds for RMS Voltage (Tools > Axis Bounds) to a Min of 92, and a Max of 108. This gives our RMS Voltage axis a spread from 92% of the nominal to 108%.
The last step is to add horizontal annotations at 105% for the upper limit and 95% for the lower limit. Click the Horizontal Line Annotation tool button, then click near the top of the graph. Edit the annotation properties: Set the Color to “Red”, Line Type to “Dash”, Text to “105%”, and Position to 105. Click the Horizontal Line Annotation tool button, and then click near the bottom of the graph. Edit the annotation properties: Set the Color to “LimeGreen”, the Line Type to “Dash”, the text to “95%”, and the Position to 95.
You now have a graph displaying steady-state voltage and voltage regulation limits in a format that works well for non-technical end-users of electric power.
NOTE: After exporting your per-unit graph, you will want to change the recording scale factors of your Voltage channels to their defaults (1) prior to performing further analysis of the data.
Conclusion
Power Monitors recorders such as the Guardian and Revolution, in concert with the ProVision software, are powerful tools for both analyzing and troubleshooting voltage regulation issues. Custom ProVision graphs allow for a simplified data presentation especially useful for presenting information to non-technical electric power end users.
