Abstract
The presence of harmonics in the voltage delivered to homes and businesses is pretty much a given due to the increase in non-linear loads in use today. These loads include such things as high-efficiency heat pumps, variable speed drives, electronic power supplies (for a variety of office equipment) and even CFL or LED lighting. While Total Harmonic Distortion (THD) is a useful tool in determining the overall harmonic level it does not give a detailed picture of which harmonics are present and to what degree. The harmonic bar charts available in Provision will show the harmonic content details of any captured waveforms. Since raw captured waveform data is used, the harmonic bar chart can show individual harmonic levels without having to record separate harmonic stripcharts in advance. The bar chart display is also an easy way to view all harmonics at once – essentially a 2D slice of the more complex 3D harmonic graph.
Provision Harmonic Bar Charts
There are two methods for getting to the harmonic bar chart screen in Provision. Both methods start by selecting the recording file to be used from the Explorer pane in Provision. Next, from the top level pull down menu select “Graph” then “Harmonic Analysis” and then “Magnitudes.” This will bring up a list of the available captured waveforms that can be used for the harmonic bar chart display. Alternatively, from the Header Report of the selected recording click on “Waveform Capture” then select the waveform to be shown in the Waveform Capture display. Now select the harmonic bar chart icon from the toolbar (Figure 1) to change to the harmonic bar chart.
Figure 2 shows a harmonic bar chart display. It has three primary sections that convey a lot of information at a glance. In addition, there are other notations and labels to give a more precise picture.
The top section of the screen shows a relatively small representation of the waveforms available for examination. This is not meant to show details of the waveforms themselves (use the Waveform Capture display for that) but instead show where the waveforms do not appear normal. Part of this waveform area is a gray slider box that can be moved to examine a specific cycle’s worth of data. The gray slider box is useful for comparing the harmonics present across the cycles that have been captured. Moving it from normal looking waveforms to those that show distortion is a quick way to gauge the levels of the harmonic content.
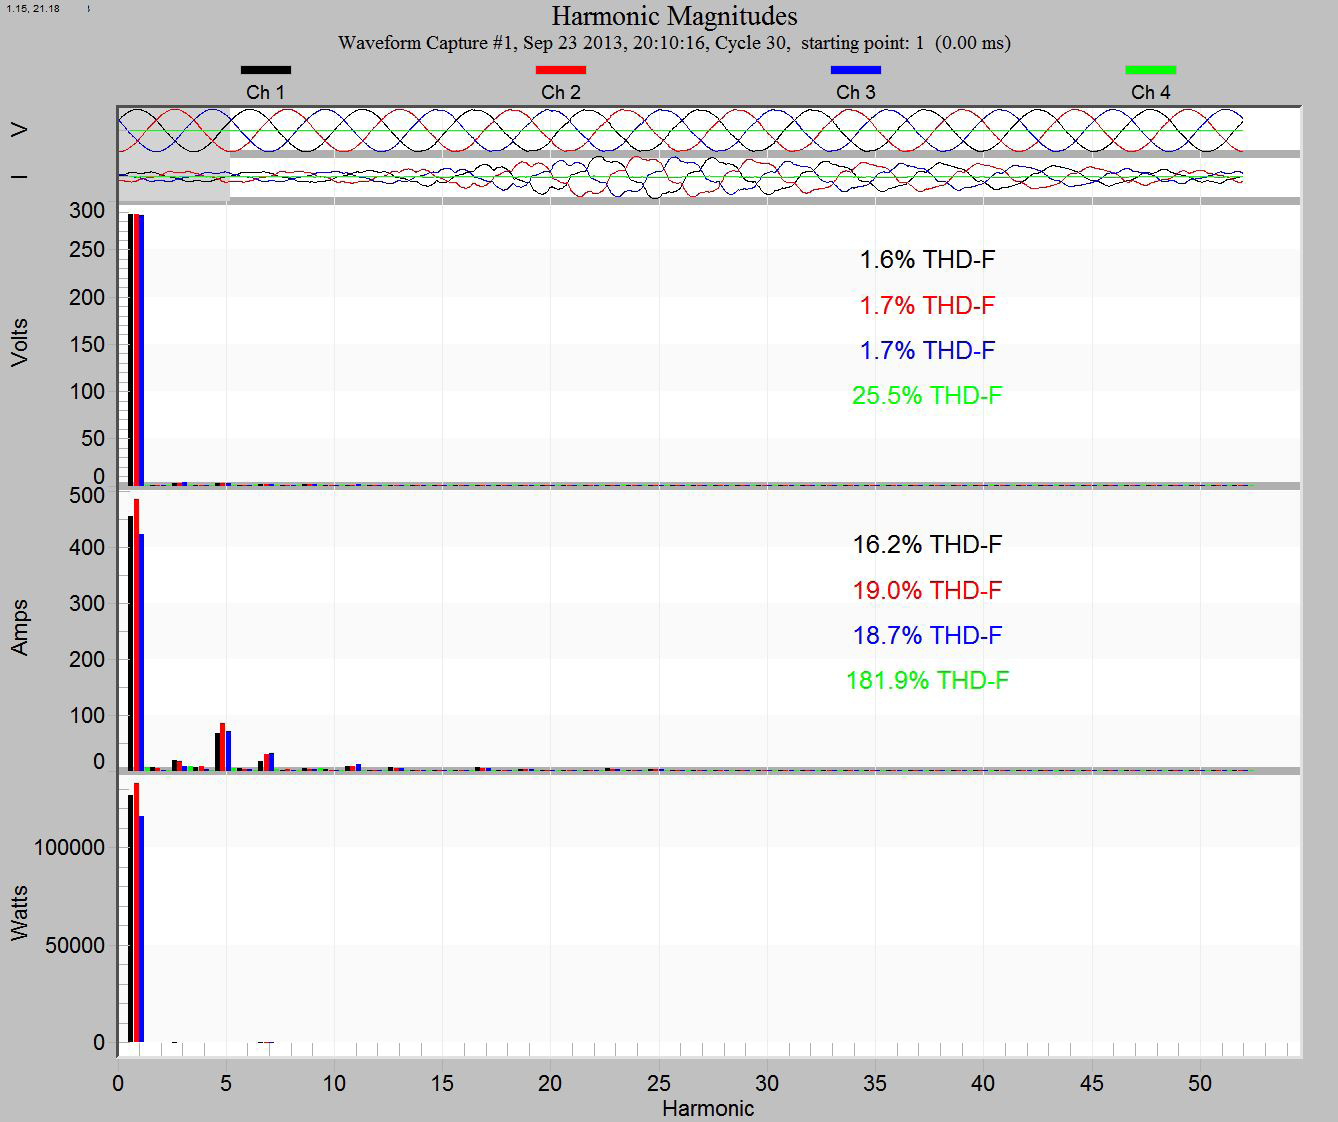
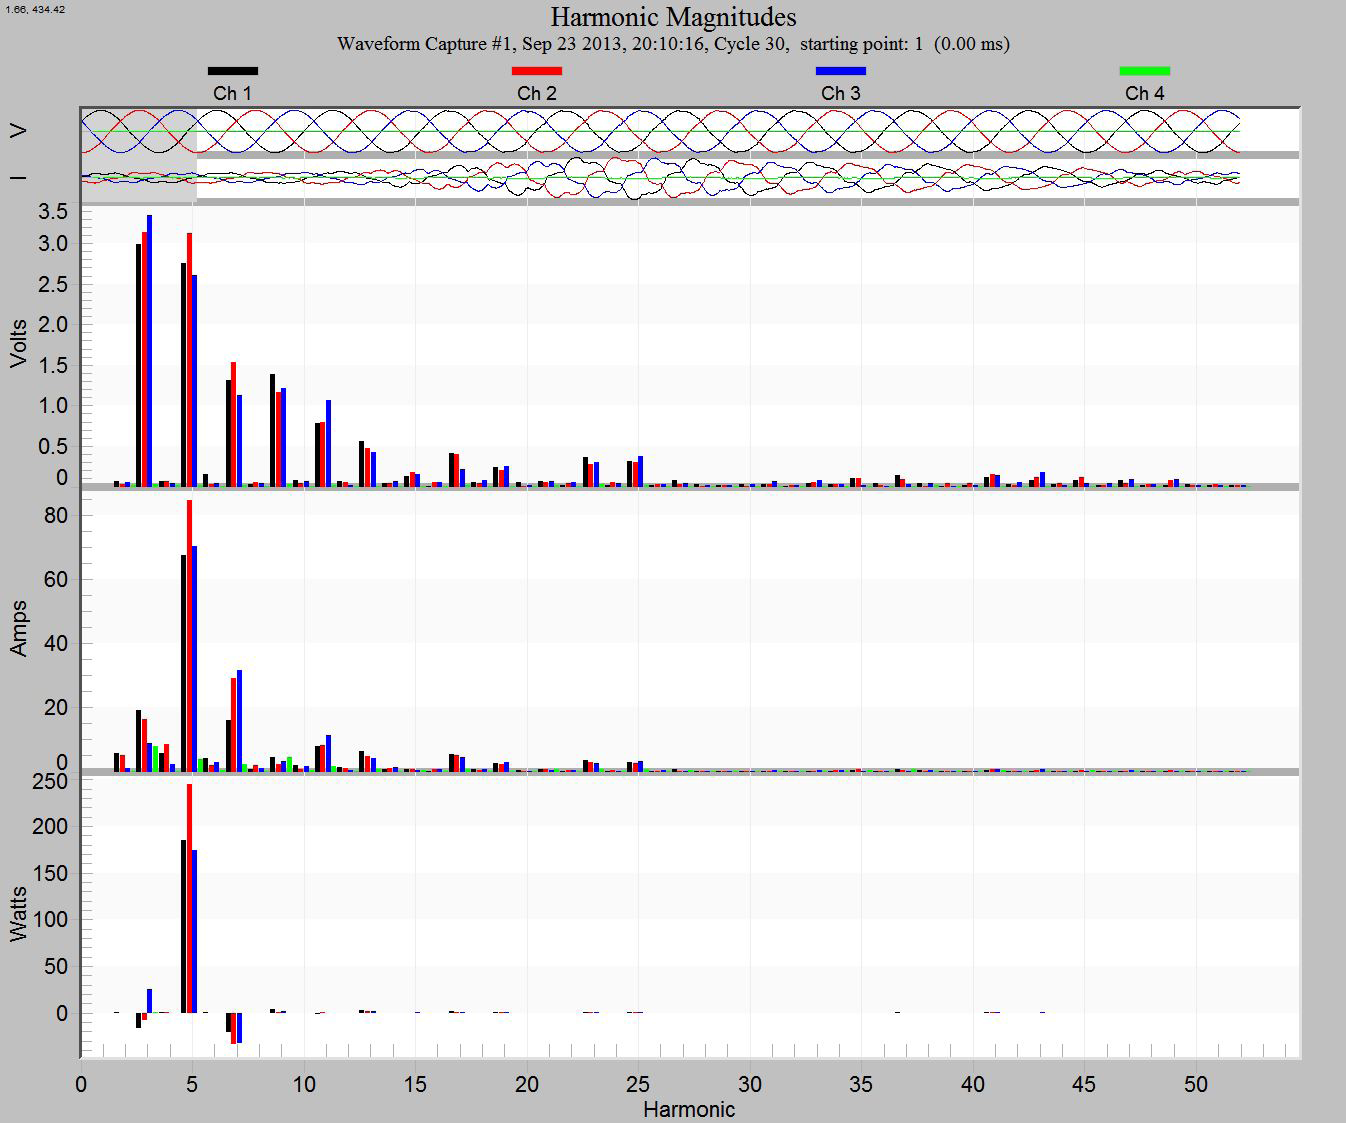
The majority of the screen is comprised of the actual harmonic bar chart display of voltage, current and power waveforms along with a numeric display of the THD from the highlighted waveform (more on this value later). The bar chart is graphically showing the harmonics present (X axis) in the highlighted waveform along with the associated harmonic magnitudes (Y axis). The bar graph is typically dominated by the fundamental (1st) harmonic, the nominal 60Hz line frequency. Right clicking in the bar chart window will present a set of options for modifying the display in various ways. One of these options is “Show fundamental (F).” When this option is turned off the display will appear similar to Figure 3. Note that the higher numbered harmonics now become more prominent and the magnitude values along the Y axis changes scale to reflect this. This harmonic bar chart shows all harmonics out to the 51st for any captured waveform in the recording. This is a very powerful feature since waveforms are captured in many recordings for various reasons.
This means that harmonic information out to the 51st harmonic will be present in most recordings without taking specific steps to actually record harmonics via stripcharts. When the harmonic bar chart has the fundamental displayed it also shows numeric values for various measurements of the waveform selected by the slider. This measurement area of the display can be clicked to cycle through even more values that again pertain to the selected waveform. There is a total of four different measurements that will cycle with each click as follows.
THD-F: This is the total harmonic distortion in reference to the fundamental and represents the ratio of the voltage or current harmonic components relative to the fundamental. This is usually referred to simply as THD.
THD-R: This is the total harmonic distortion in reference to RMS and represents the ratio of the voltage or current harmonic components relative to the RMS values. This value is more useful when dealing with audio reproduction of signals.
TIF: The telephone interference factor is a measure of the potential telephone noise that may be caused by the measured harmonic distortion. The TIF measurement focuses on the frequencies that tend to cause interference in the audible range of the human ear.
KF: The K-factor is a measurement of current harmonic distortion that is used to de-rate transformers due to harmonics.
The harmonic bar charts are very useful for getting a snapshot picture of the harmonic content over the recording period. This can be accomplished by examining any captured waveforms. The default recording parameters will have waveform capture enabled so many if not all recordings should have some captured waveforms. Even better would be to set the recording parameters to do a periodic waveform capture perhaps once every hour or couple of hours. This allows for what amounts to a steady state harmonic analysis over time which may help to pinpoint any issues that come and go based on time of day. The other benefit to examining harmonic content with captured waveforms is that it does not consume additional recorder memory beyond what is already used by the captured waveforms. This is due to the fact that the waveform based bar chart view of harmonic content does not require a recording of specific harmonics which are used to create individual harmonic stripcharts. The harmonic bar chart content is calculated by Provision using the raw waveform data.
The bar chart graphic view of harmonics makes it easy to see where harmonics are present and their relative magnitudes. This visual look will make it easier to identify problems based on specific harmonics or patterns of harmonics as seen on the graph. Recording specific harmonics to examine via stripcharts may be the next step in diagnosing a problem but harmonic stripcharts consume a significant amount of the recorder’s memory and, therefore, shortens the recording time. Once specific harmonics are indicated by the bar charts, targeting these known harmonics for further analysis via stripcharts will save recording memory and increase recording time.
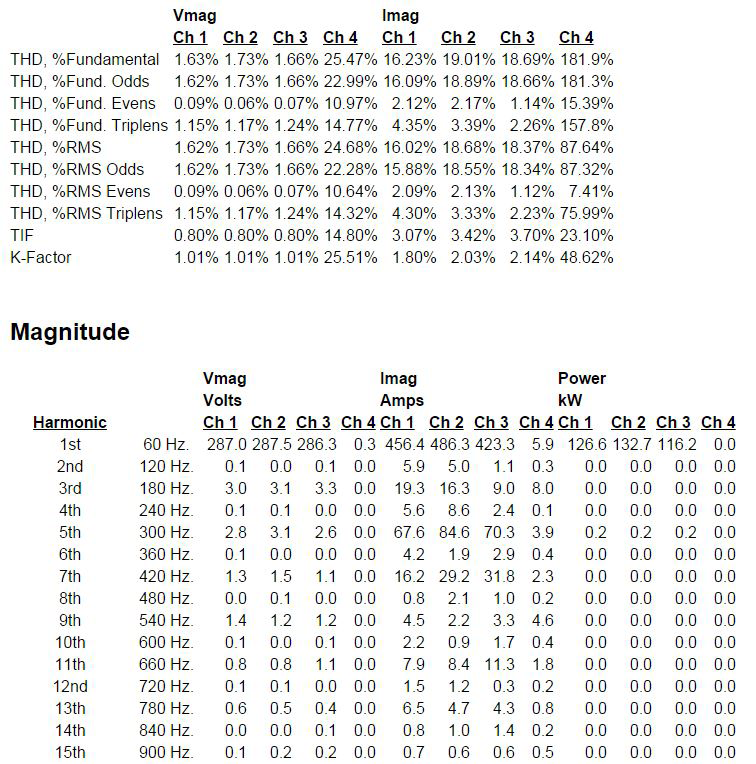
In addition to the graphical view of the bar charts, there is also a Harmonic Analysis Report that will give a numeric breakdown of the data seen on the bar chart. This is accessed by right clicking on the bar chart screen to access the additional options. Choose “Launch Report” to see the information in report format which is partially shown in Figure 4.
Conclusion
Harmonic bar charts are yet another tool to be used in monitoring, troubleshooting and maintaining power distribution systems. They give an excellent visual representation of harmonic content that can be used to spot check power quality over time or they can be used as a diagnostic tool to help solve problems related to harmonics. All PMI recorders that capture waveforms (Revolution, Eagle series, Eagle 120, Guardian, VIP, 2SX+, etc.) will have harmonic bar charts available when viewing recorded data with Provision.
