Abstract
Total Harmonic Distortion (THD) is a way of quantifying the amount of harmonic content in a voltage or current waveform. In addition to measuring the amount of distortion, THD can also be used to help track down the source of harmonic distortion. Although recording individual harmonics allows for a more detailed analysis, a full harmonic recording consumes a very large amount of memory, resulting in a shorter recording time, or very large data files. Recording just voltage and current THD instead of a full set of harmonics doesn’t take up much extra memory – little enough that it’s worth recording “just in case”, even on non-harmonic investigations. Relationships between THD and RMS values to help understand and track down harmonic sources are described below.
Definition of THD
As defined the whitepaper Understanding THD, THD is a measure of harmonic distortion. Expressed as a percent, the THD is a comparison of the 60Hz fundamental magnitude to the total of all harmonics. A value of 0% indicates a pure 60Hz sinewave with no distortion. Typical voltage THD levels are 0.5 to 5%, while current THD ranges from 0.5% to 80% or more, depending on the type of load. The sizeable difference in those ranges is due to the system impedance and the relationship to voltage and current in the distribution system.
Utility voltage is generated as a pure 60Hz sine wave, with no harmonic distortion. When nonlinear loads are attached, harmonic currents flow. These harmonic currents result in corresponding voltage drops along the distribution wiring and across transformers, due to their non-zero impedances (Figure 1). In a typical distribution system, the voltage source impedance is very low (ideally zero) compared to the load impedance. Stated another way, the available short circuit current is much higher than the typical (or even maximum) load current. At 60Hz, this difference insures that voltage sags due to high load current are a small percentage of the line voltage. Similarly, harmonic voltages developed from harmonic currents are correspondingly smaller, and the resulting voltage THD is much smaller than the current THD causing the distortion.
If the voltage has a non-zero THD, even a perfectly benign linear load (e.g. electric heater, incandescent lighting) will draw harmonic currents, in proportion to the harmonic voltage. In this case, the current THD will be similar in magnitude to the voltage THD, rather than much higher. In general, if the current THD is roughly similar in size to the voltage THD, it’s likely that the monitored load is not responsible for the voltage THD.
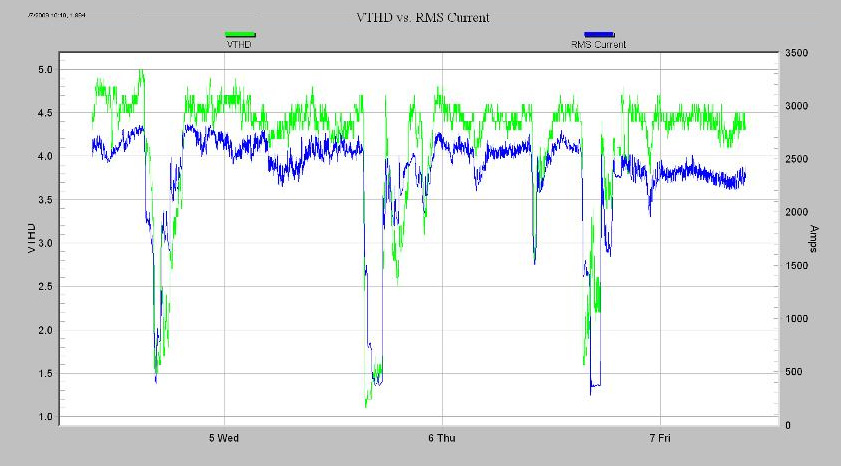
Unfortunately, the current THD is often much higher than the voltage THD. In these cases, examining the voltage and current THDs along with the load current can provide some clues as to the source of harmonics. In Figure 2, the RMS current is graphed with the voltage THD. There’s a clear correlation between the voltage THD and current – the voltage THD jumps from a mildly elevated 1.5% to a very high 4.5-5% when the large 2500A load turns on. The high load current is a significant faction of the short circuit current, and thus has a large influence on the voltage THD.
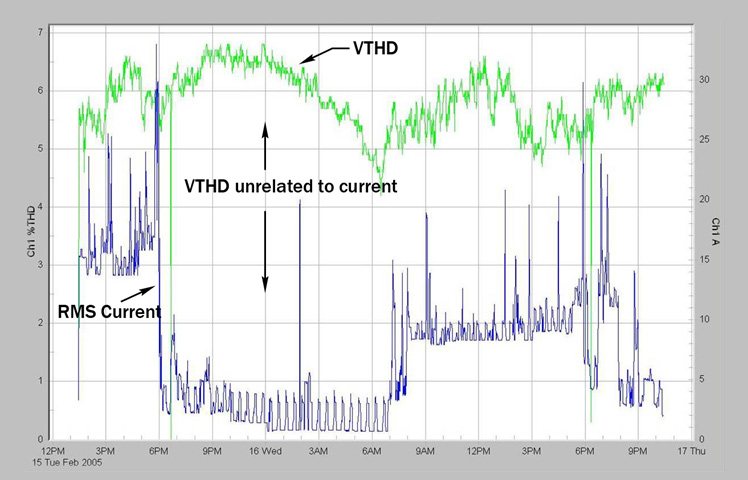
The opposite case is shown in Figure 3. Here, the voltage THD is over 6%, but shows little correlation to changes in RMS current. This is a strong indication that the monitored current is not the cause of the voltage THD. There are large step changes in current with no change in voltage THD, and the voltage THD varies over a wide range with no change in load current.
THD and Voltage
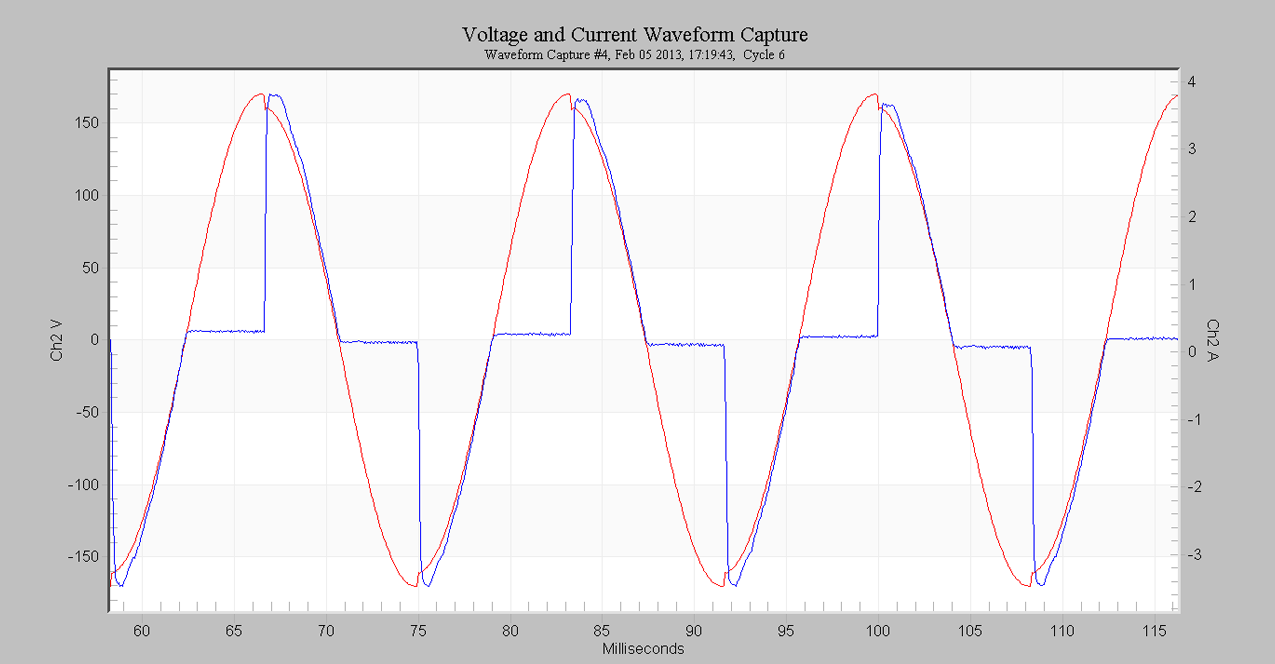
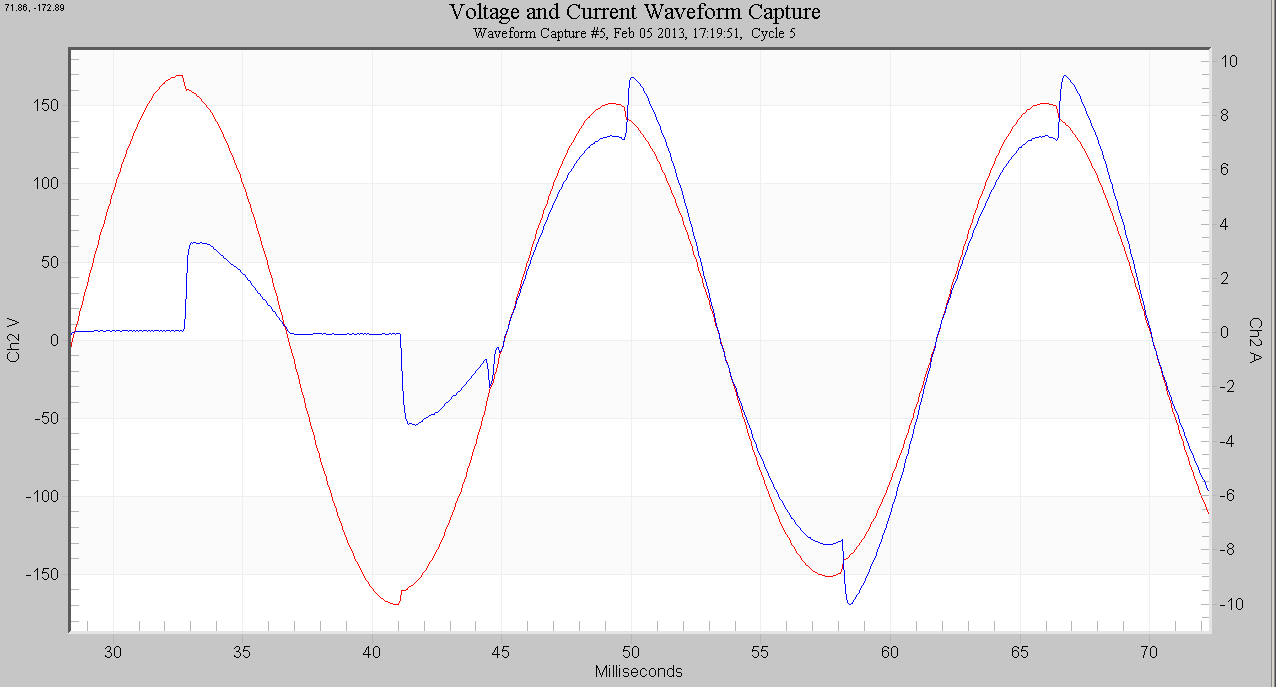
The voltage THD and current relationship is not always so clear-cut. If the current is a mix of linear and nonlinear loads, RMS current shifts can produce unexpected voltage THD changes. To illustrate this effect, an AC voltage source and two loads, one linear and one nonlinear, were used to produce a test recording. The nonlinear load is 1.6A, with a THD of 68% (Figure 4). The voltage THD with just this load is around 2% (with no load, the voltage source is less than 0.3%). The linear load is 5.3A, and its current waveform is an exact replica of the voltage source, by definition. Figure 5 shows a waveform capture that starts with the nonlinear load, then the linear load is also switched on. The current THD is the 68% value with just the nonlinear load, but the combination of the two is actually more sinusoidal – the current THD drops to around 12%. The composite current waveform still contains the harmonic currents from the nonlinear load, but the much larger 60Hz current tends to mask them.
The RMS values and THDs for voltage and current are graphed in Figure 6. The “nonlinear” and “both” annotations are when the respective loads are energized. The voltage THD (green trace on lower graph) is around 1.8% with just the nonlinear load, produced from the 1.6A and 68% THD in the load. The source impedance (known to be 2 ohms here) is much lower than the load impedance (120V/1.6A = 75 ohms), so the 68% THD translates to just 1.8% THD on voltage. When the 5.3A linear load turns on (“both”), the voltage and current THDs both drop. The current THD is around 12% now – since the linear load’s 5.3A is much higher than the nonlinear load, the proportion of 60Hz current vs. the harmonics is higher, resulting in a lower overall current THD. The total harmonic current is unchanged, but as a proportion of the total current, it’s less. The voltage THD is caused by the harmonic currents dropping voltage across the 2 ohm source impedance, so it must reduce if the current THD does. Here it drops from 1.8% to 1.5%. Even though the voltage THD has improved a bit, the RMS voltage has dropped significantly (from 117V to 108V), possibly introducing another PQ issue. Any 60Hz current change that’s large enough to actually improve the THD is likely to be so large as to sag the voltage a noticeable amount.
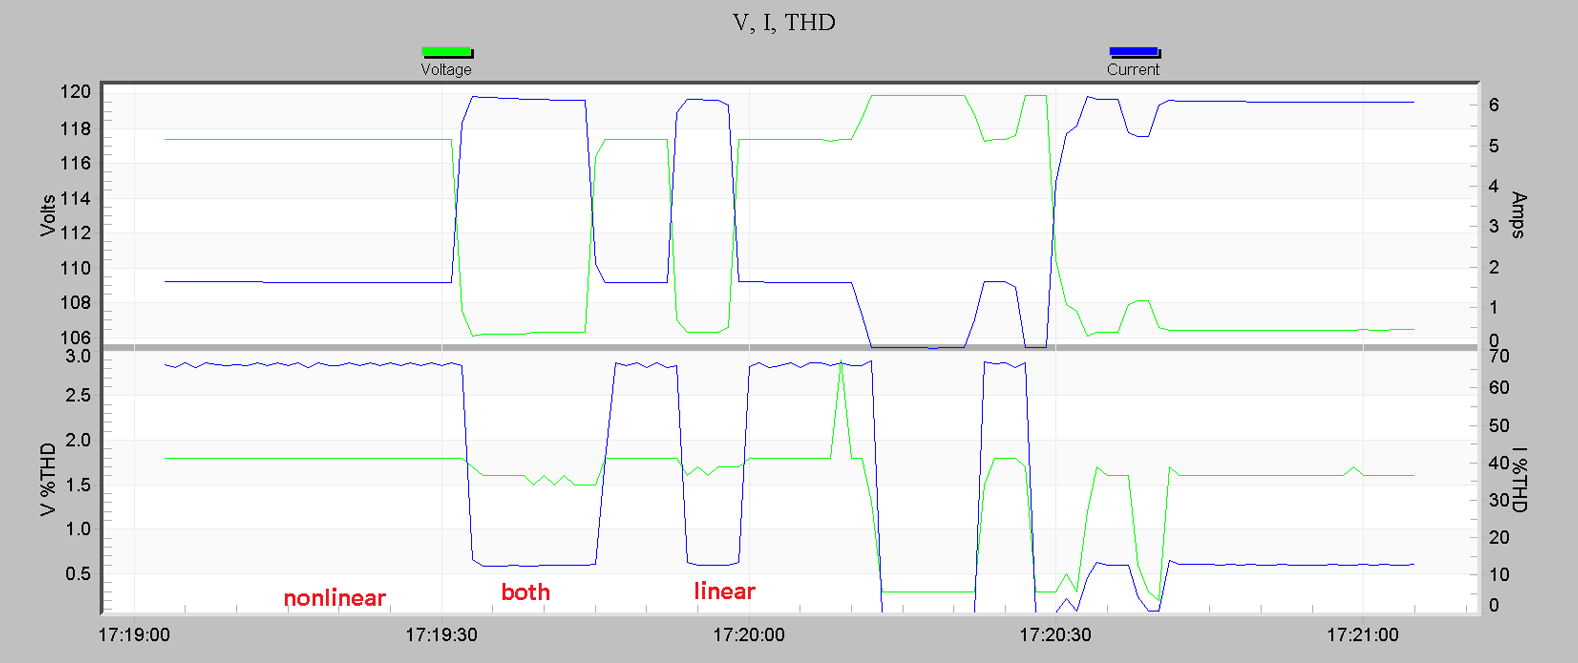
In this stripchart, we have the voltage and current THDs dropping in response to an RMS current increase. Despite the opposite movement of that shown in Figure 2, the monitored current is actually producing the THD. It’s combined with linear current that’s reducing the THD (although the underlying harmonic magnitudes are unchanged), making the interpretation less straightforward.
The key point from this example is that monitoring a complex mix of loads can result in differing correlations between THD and RMS current, as various types of loads switch off and on. When the linear load switches off and on, there’s a very marked change in current and voltage THD, but that load is not causing any harmonics – rather, it serves to mask the offending load by lowering the overall THD. By carefully following the timeline of voltage and current THD, and voltage and current RMS values in the stripchart, a complete harmonic picture may be pieced together.
Conclusion
Voltage and current THD are essential in quantifying and tracking down harmonic loads. The relationships between RMS voltage and current, and voltage and current THD can be complex, but offer important clues pointing to the root harmonic offender. By keeping in mind the fundamental voltage and current relationship in Figure 1, the contributions from various loads can be untangled and used to estimate the source of harmonics.
