Abstract
Recording interharmonic data is a new feature available in certain PMI recorders. Recording of interharmonics is a new feature in the Revolution, and requires at least the firmware version 5.66 update. For recorders with prior firmware, this update is available at no cost. Subsequently, the ability to initialize these recorders to record interharmonic data is a new feature in ProVision, as is the creation of graphs and reports containing interharmonic data. These features are now included in ProVision, available starting with version 1.61 build 4800. Interharmonics that can be recorded in ProVision are divided into different types: individual, interharmonic groups, interharmonic subgroups, harmonic groups, and harmonic subgroups. This paper is an overview of the interharmonic support features in ProVision.
Initialization
To modify interharmonic settings for a compatible recorder in ProVision, first open the initialization dialogue for that recorder. To do this, right-click the recorder in the Device Tree, and, from the resultant context menu, select the option for “Initialize”. These steps can also be performed for a recorder settings template. The settings for interharmonics are a new addition to the “Interval Graphs” settings screen, which is the first advanced settings screen displayed.
ProVision offers multiple types of interharmonics available for being recorded: harmonic groups, harmonic subgroups, interharmonic groups, interharmonic subgroups, and individual interharmonics. Furthermore, the additional THD values can also be included.
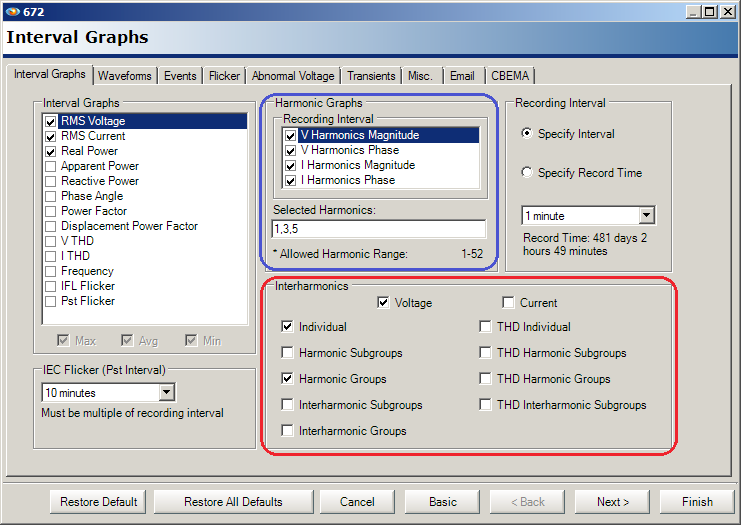
The two primary regions of the settings screen for interharmonics are designated in Figure 1. The blue region signifies which harmonics are to be recorded. The red region, a new addition, designates which interharmonics are to be recorded. The checkboxes therein determine which interharmonics for the specified harmonics will be recorded, and for voltage, current, or both. In Figure 1, the harmonic subgroups for the first, third, and fifth harmonics will be recorded, along with the individual interharmonics from 60 to 115Hz, 180 to 235Hz, and finally 300 to 355Hz. If the checkbox for Current is selected, the same data for current will also be recorded for those harmonics. The THD values for the interharmonics can be selected in a similar fashion.
NOTE: Total recording time is determined when a checkbox is selected or cleared. For every harmonic, there are, (depending on line frequency) up to eleven individual interharmonics, for each voltage and current. Individual Interharmonics are best used with a targeted approach with specific frequencies. If using a range of frequencies, it’s better to start with only using harmonic or interharmonic groups.
When all settings are finalized, select “Finish” to send the settings to the recorder or to save the settings template. Note that initializing a recorder purges all recording data on it, so ensure the recording has been retrieved prior to initialization.
Interharmonic Reports
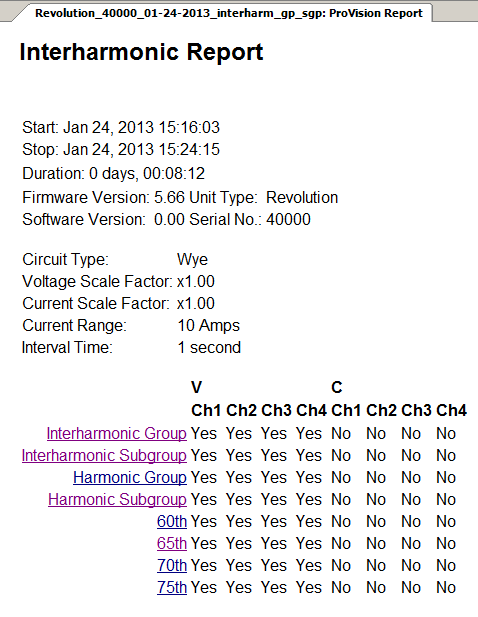
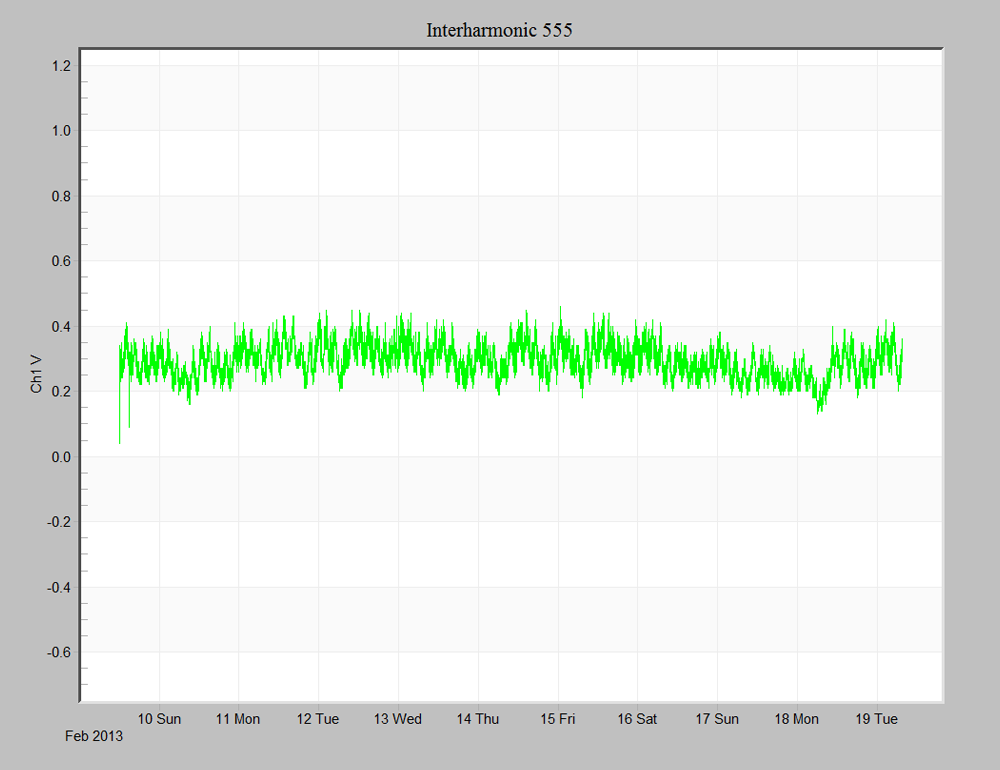
Interharmonics reports can be generated from recordings containing interharmonic data. To create a report, first select the checkboxes next to the recordings, then on the report menu, select Interharmonic Report. As shown in Figure 2, the generated report displays information about which interharmonics are recorded, whether voltage, current or both were recorded, and for which channels data is recorded. For individual interharmonics, these are displayed as the frequency they measure. For harmonic groups and subgroups, and interharmonic groups and subgroups, these are displayed at each primary harmonic. Links are also present in the report for each listing that, when activated, launch a graph displaying the data for that listing as shown in Figure 3. These graphs, once launched, can be treated as any other stripchart graph in ProVision and can be printed, exported, or mixed.
The information on the interharmonics report is also displayed in an abridged form on the Header Report. This information includes what type of interharmonic data are recorded, whether for voltage, current, or both, and on which channels. Note that the listings for which specific harmonics the interharmonics were recorded for is not present as that is available on the Interharmonic report. The channel headers here are links as well, but when activated, they do not launch graphs for individual traces like in the interharmonic report—instead, a 3D graph is launched displaying all available harmonic and interharmonic data. This 3D graph is the same as the harmonic interval 3D graph also launched from the header report, only with the inclusion of the interharmonic data.
Interharmonic THD Graphs
For recordings that have THD data stored for interharmonics, this data can be viewed in graph form by opening the graph menu, then selecting THD Interharmonic Graph, then either Voltage THD or Current THD, then the channel to view data for.
Custom Graphs
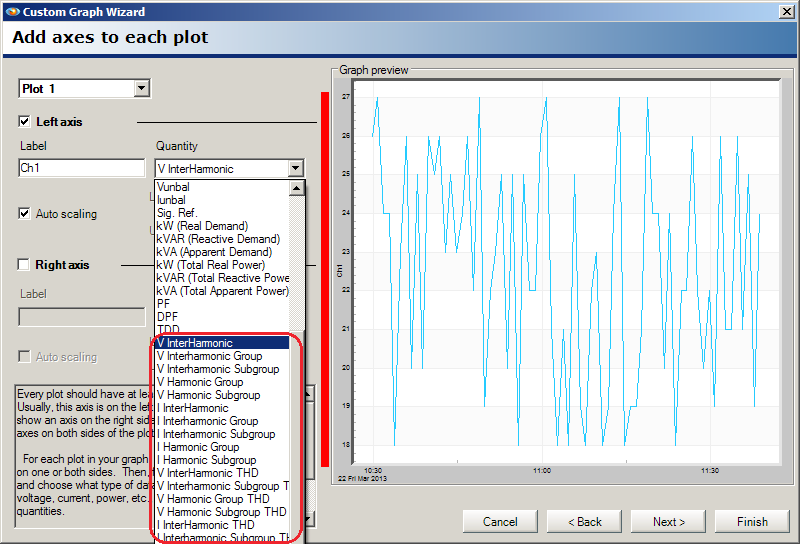
Support for interharmonics has also been added to ProVision custom graphs. To create a custom graph, open the Tools menu, then select “Custom Graph Wizard”. On the screen for creating axes, in the dropdown box for quantity, the new types for interharmonics have been added at the bottom (Figure 4). Note two of each listed: one for current, and another for voltage. These can be specified similar to any other type.
On the trace selection screen, ensure that each axis for an interharmonic measurement has the checkbox for Ave selected and that the ones for Min and Max are cleared. This is because only average values are recorded—there are no minimum or maximum values.
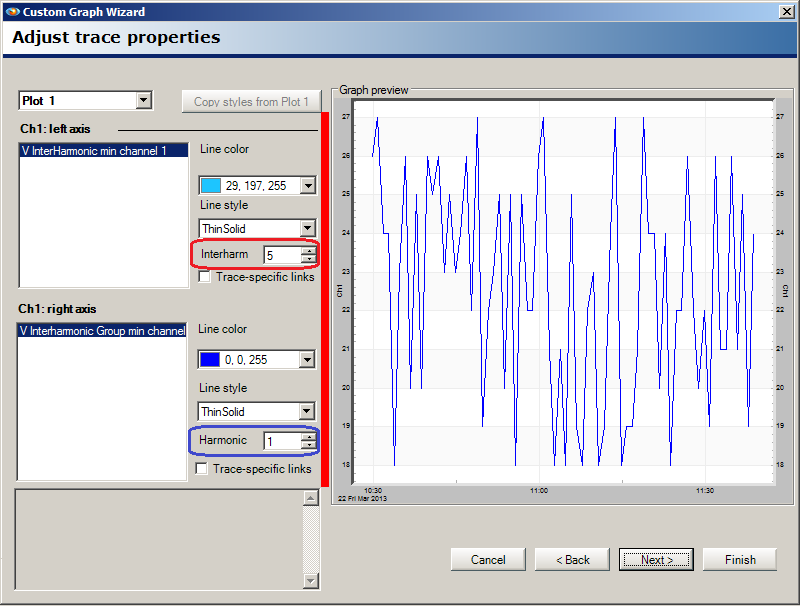
On the next panel, specific parameters about the selected interharmonic trace can be specified. For the basic individual interharmonics, for both voltage and current, the frequency can be specified, as shown. The frequency must be specified as a multiple of five and can be any value ranging from 5 to 3115 inclusive. For other interharmonic measurement types, the same field is used to specify the harmonic. These are shown in the screenshot circled in red and blue, respectively. The valid values for harmonics are 1-51 inclusive. After the harmonic or interharmonic frequency has been specified, the custom graph can be completed normally as shown in Figure 5.
3D Interharmonic Graphs
The interharmonic 3D graphs can be accessed via the header report as mentioned in the previous section, or by, from the Graphs menu, selecting 3D Harmonic Graphs, then Voltage or Current, then the appropriate channel. The only difference between accessing the graph via the header report versus through the menu is in the former, the interharmonic data are visible by default. With the latter, only harmonic data are shown.
To modify the data displayed, right-click on the graph and, from the resultant context menu, choose “Select Interharmonics”. This opens a new window populated with listings for each harmonic and interharmonic trace available in the recording file. These individual traces can have their visibility toggled by changing the state of the checkbox next to the name of the trace. Selecting the OK button redraws the graph with the applied changes.
Figure 6 shows a resultant graph where only certain traces are visible. This allows to only focus on the relevant data. For example, in the system this recording was sourced from there is a powerline carrier meter-reading system transmitting signals at 555 and 585Hz, so those interharmonics are higher than the other interharmonics shown.
Conclusion
Being able to initialize recorders for select harmonics and their corresponding interharmonics, as well as knowing the tools offered by ProVision to analyze these data, can be very convenient. This can simplify the process of analyzing harmonic data, when it can be supplemented by interharmonic data.
