Abstract
In this whitepaper I describe and compare two of the IEEE Flicker standards, the older standard 141 (the GE Flicker Curve), and the newer IEEE 1453 (Flicker Meter standard). The 141 standard is based on studies performed on human perception of light flicker using a simple square-wave voltage variation at a constant frequency, and the newer IEEE 1453 standard provides an improved method for evaluating the perception of light flicker by handling complex loads from multiple sources or with varying rates of occurrence.
What Is Flicker?
Flicker is a very complex aspect of power quality that is somewhat subjective by nature due to how an individual perceives it. When most people or power consumers refer to flicker, it is usually in reference to an inconstant or wavering light. A more precise definition of lamp flicker quoted from the IEC technical vocabulary is, “The impression of unsteadiness of visual sensation induced by a light stimulus whose luminance or spectral distribution fluctuated with time”. Perceiving excessive flicker involves the eyes and the brain, and if it continues for a long enough time, it can be very irritating and annoying to a customer. The point at which flicker becomes irritating or even perceivable varies person to person and can depend on many factors. Some of these factors include a person’s age, neurological, psychological and overall health, and the individual’s critical flicker frequency.
Critical flicker frequency (CFF) also referred to as flicker-fusion occurs within a range of about 5 to 50 Hz. Under normal steady state power conditions, most people would observe an incandescent light bulb to be emitting perfectly steady light as if the power source was DC even on a 60 or 50 Hz system. The CFF gradually decreases with age in adults; however, there are some differences from person to person even at the same age. Some humans can perceive visible changes in light output with as little as 0.25% changes in the RMS voltage that powers the light source. To summarize, some people are more sensitive to flicker than others, so flicker is very subjective and heavily dependent upon human perception. As with most human traits, there is a bell curve type response with the norm being toward the center of that curve. The IEEE 141, the GE Flicker Curve, was based on the norm and not the extremes of human perception of flicker.
Flicker Causes
Flicker is caused by voltage changes produced by load currents flowing through system impedance. The effect of large loads produces voltage modulation on the line creating noticeable changes in light intensity. Loose connections can also contribute to large amounts of flicker due to the elevated impedances on the system.
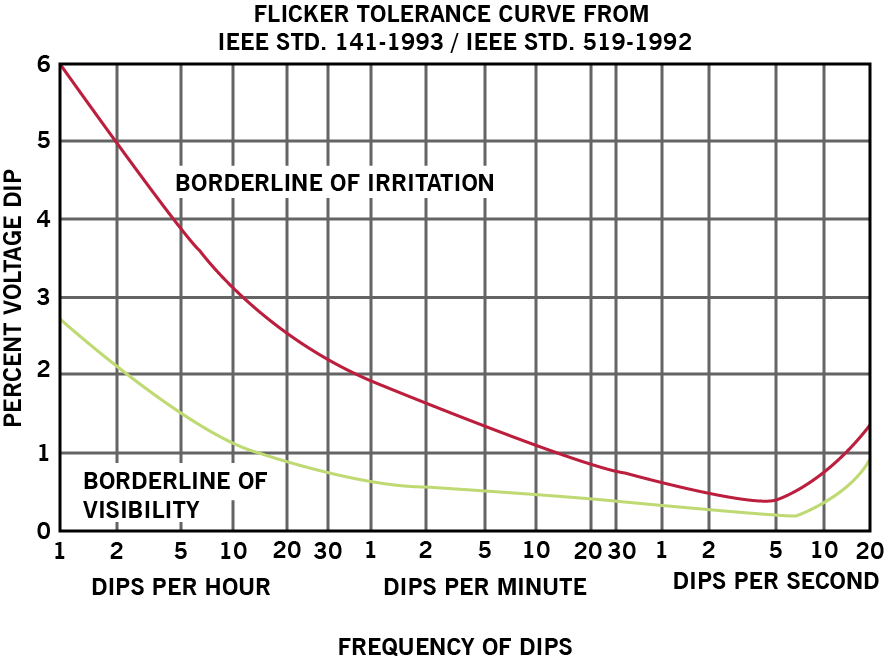
IEEE 141 the GE Flicker Curve
GE Flicker Curve, or IEEE 141, shown in Figure 1, is one of the oldest and most common flicker reference curves, so I will cover this standard first. It was developed by General Electric in 1930. This curve is based on testing that GE did on several utilities and was originally referred to as GET-1008L and then republished in the IEEE Red Book as the IEEE Standard 141-1993. The GE Flicker Curve shows two curves, the threshold of perception and a threshold of irritation. The GE Flicker curve is based on square-wave changes to voltages at the frequencies indicated on the graph. When the load is changed in a more gradual fashion than in a voltage step such as a square wave, the flicker is much less noticeable. Human eye-brain response is much more sensitive to a rapid change in light intensity than slow changes in light intensity. The GE Flicker Curve is based on the number of dips per minute, second or hour. The change of apparent light intensity varies with the type of light being used. In smaller incandescent bulbs, the filament thermal mass is lower than in larger incandescent lights. This causes the filament to change temperature more rapidly, thus photon output and light frequency or color in these bulbs makes flicker more noticeable for the same change in voltage and duration. In general, fluorescent lights flicker less for a given amount of voltage input change than incandescent unless the input voltage approaches their voltage turn on threshold. This can also vary with the thermal temperature of the fluorescent lamp and how old the tube is. The GE Flicker Curve is represented by the percent of voltage dip on the vertical axis versus the frequency of dips on the horizontal axis. This graph does not indicate direct changes in luminosity but is correlated to a change in the light output with a change in voltage.
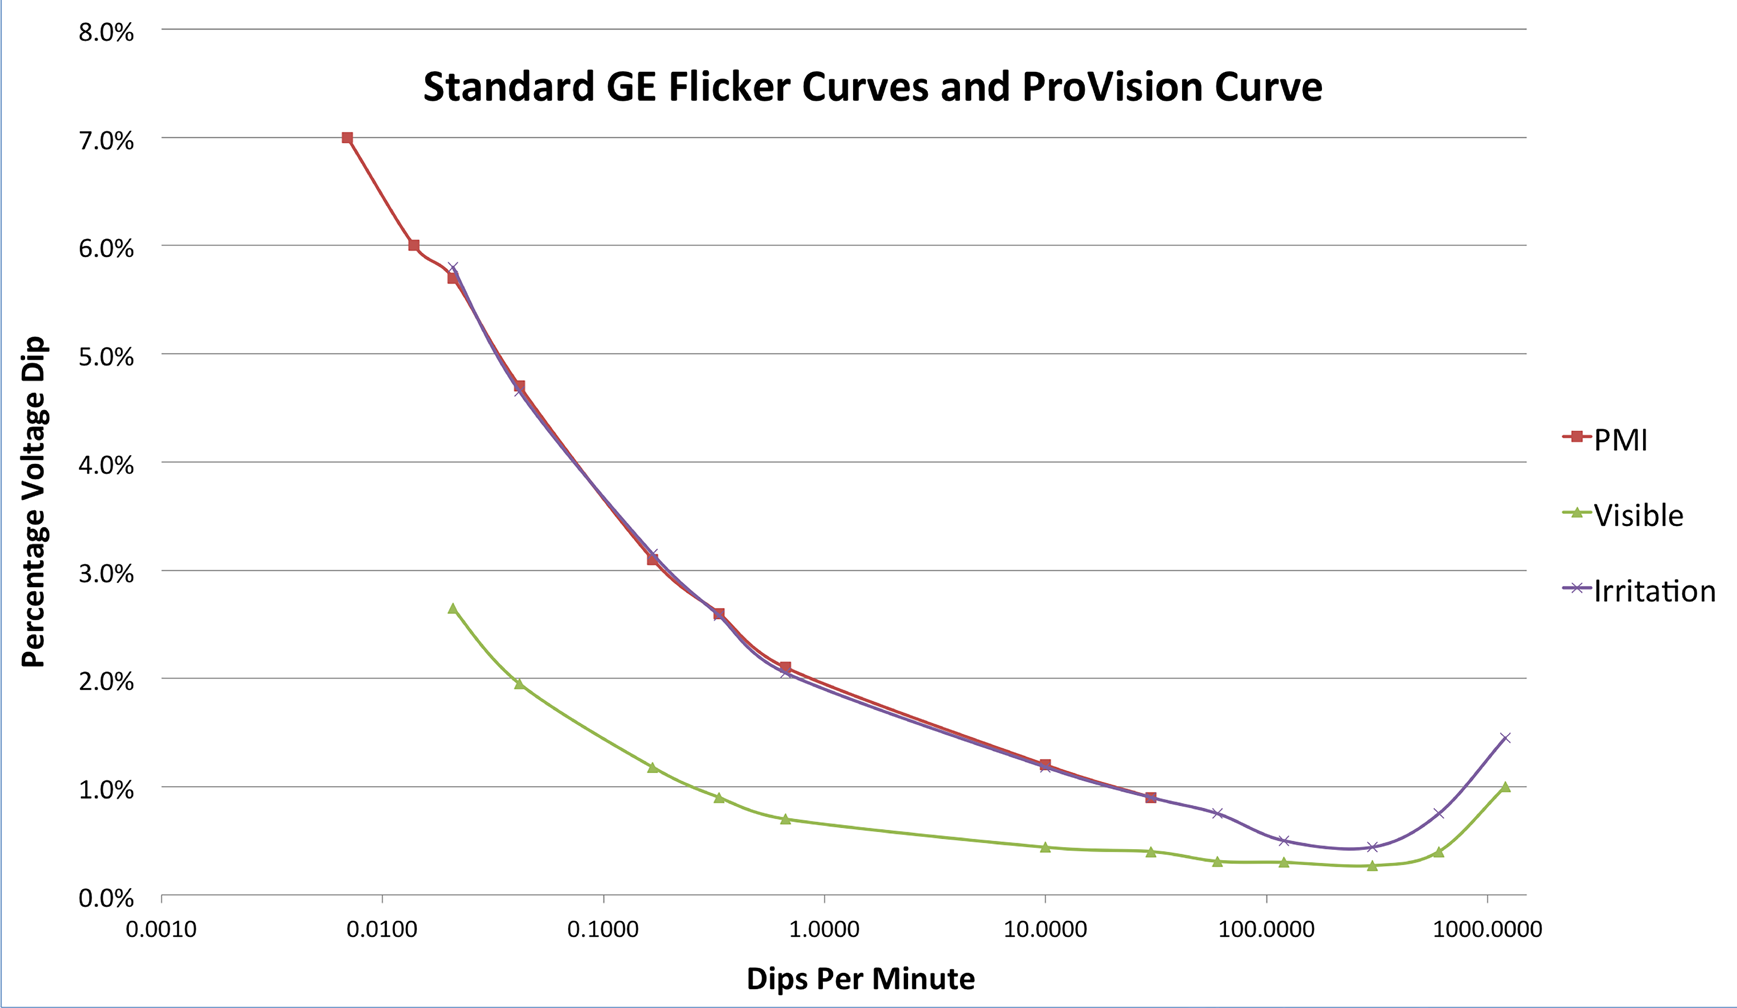
PMI’s recorders default to the threshold of irritation curve from the above IEEE Standard 141 shown in the top curve in Figure 2. This curve was generated to show voltage flicker that humans perceive to be irritating. When this level of voltage fluctuation occurs, a flicker event is recorded with the flicker time and magnitude. The allowable voltage threshold and the limits on their quantity in a certain time span for the default settings in ProVision are taken directly from the GE Flicker Curve, conforming to IEEE Standard 141. Since the GE Flicker Curve is somewhat subjective, sometimes it may be beneficial for a specific test to have values other than the typical borderline of irritation curve. In this case, the defaults can be easily altered in ProVision by the operator.
In PMI recorders, flicker is computed once per second, based on the previous second’s one cycle maximum, minimum, and one-second average RMS voltage levels. The thresholds are given as a percentage. If the minimum, maximum, or the average varies from one another by more than the percentage for a certain time period, then a flicker event is incremented. Also, if the counter value exceeds the limit for a certain time period, a flicker event is triggered.
IEEE 1453 the Flickermeter Standard
IEC 61000-4-15 Flicker Meter Standard, developed in Europe was later adopted and incorporated into the IEEE 1453 standard. The combined standards recognize the need for a new method of flicker measurement. The standards outline the few facts that the old standard IEEE 141 didn’t account for. The standards realize that real loads produce modulation and voltage magnitude that is more complex than what was originally used in the GE flicker curve tests. In AC power systems most situations are combinations of several flicker sources. The combination of sources can come from random loads, varying patterns of operation, and multiple levels at various frequencies.
The GE flicker curve was a great tool that has served utilities well for a long time. It is still a very useful tool for evaluating simple, mainly square wave loads from a single flicker source, but the newer IEEE 1453 Flicker Meter measurement that we incorporate as an option in the initialization of our power quality recorders, provides a superior method of evaluating flicker from today’s more complex multi source light flicker issues.
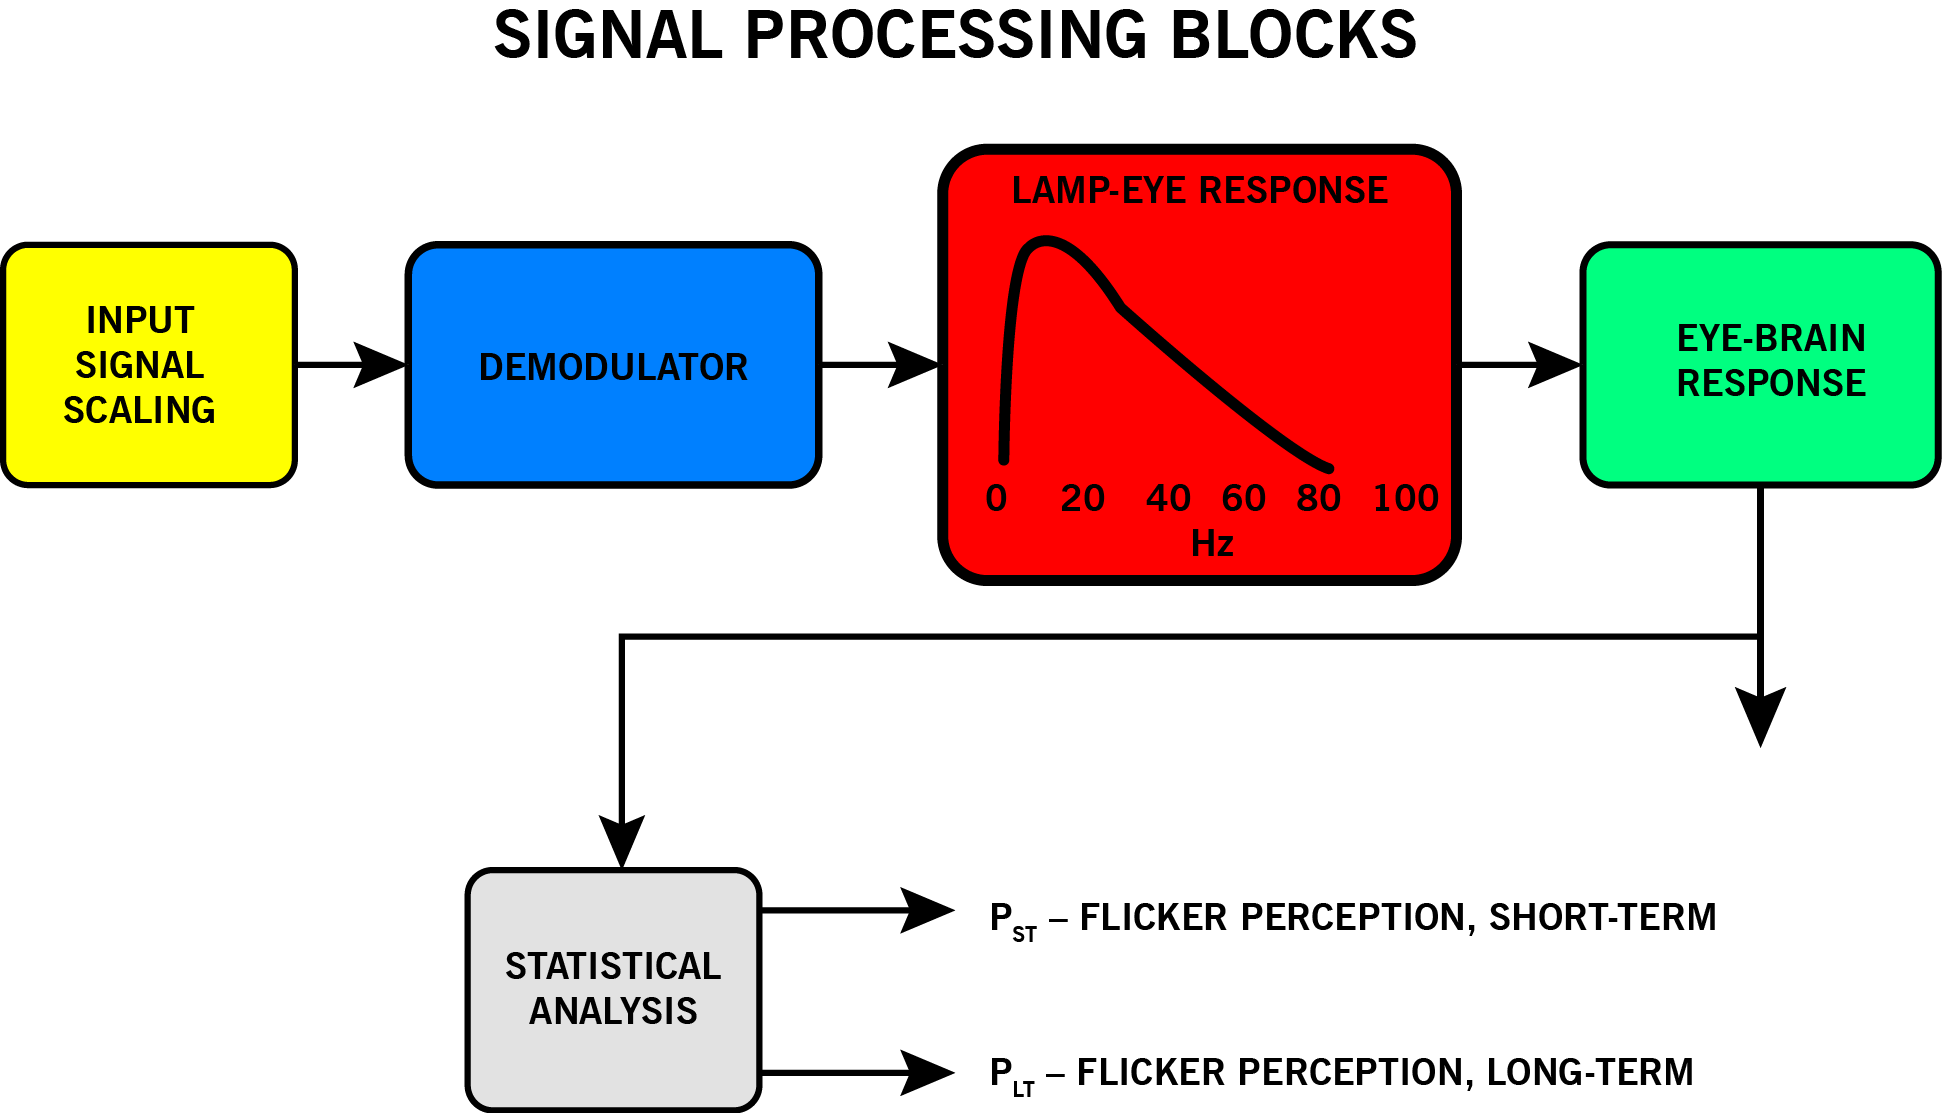
The main advantage of the Flicker Meter method is its ability to accurately model the human flicker perception. This is accomplished by five signal processing blocks described in the IEC standard, which represent the lamp-eye-brain response to light flicker. This involves the response of a lamp to supply voltage variations, the perception of the human eye and the memory characteristics of the human brain. A simplified block diagram of this system is shown in Figure 3.
Functions of the IEEE 1453 Flickermeter
The Flicker Meter standards require a normalized input voltage. It demodulates a flicker signal from the 60 Hz waveform, filters and weights the flicker signal, samples the instantaneous flicker signal (IFL), and then performs statistical analysis of the IFL. From this information it is able to calculate Percentile Short Term flicker, (Pst) and from that it can calculate Percentile Long Flicker (Plt).
Flickermeter Definitions and Equations
IFL, Instantaneous Flicker Level, is directly based on the IEEE 1453, IEC 61000-4-15 standards. As its name implies, IFL quantifies voltage fluctuation at a given instant. Phenomena that would cause sudden voltage sag to occur, such as a low impedance load suddenly being connected cause an immediate change in the IFL data. IFL calculations are based on human studies that provided an eye-brain sensitivity curve for different modulating frequencies regardless of how often the fluctuations may occur.
Pst, Percentile Short Term flicker is based on IEEE 1453, IEC 61000-4-15 standard. Pst is a measurement associated with noticeable flicker of incandescent lights due to fluctuation of the AC voltage that powers the light. The “P” in Pst stands for “percentile” and is a statistical measure of the flicker severity factor. “P” can be evaluated on a 10 minute basis in which the “ST” stands for Short Term. Short Term is defined over a 10 minute interval versus Plt – where the “LT” stands for a Long Term interval of 2 hours. Plt values are derived from the following formula:
Plt or Percentile Long Term flicker is also based on the IEEE 1453, IEC 61000-4-15 standards. Plt is the measure of long term flicker used for determining the combined effect of several randomly operating loads. Plt is a root mean average of the Pst value over 12 period sliding time spans.
Plt values above 1.00 are generally considered a potential issue. During the development and testing phase, 1.00 was established as the value where half of all people tested indicated that the flicker level was noticeable and found it to be irritating. Plt can be computed by software after a recording by using only the Pst data.
Conclusion
The main benefit of the Flicker Meter system is that the IFL, Pst and Plt values are numerical outputs provided at regular time intervals, which can be presented as graphs in power quality analysis software. Time trends of long and short term flicker perception for the duration of the recording session can be viewed and printed to evaluate variations in flicker severity for individual customers. In addition the more complex measurement is suitable for multiple sources of flicker with complex voltage modulation.
IEEE 141, GE flicker curve has served utilities reliably for many years and is still useful for evaluating simple load fluctuations from single flicker sources, the newer IEEE 1453 Flicker Meter standards provide an enhanced method for evaluating human perception of light flicker due to complex loads from multiple sources or customers with varying rates of occurrence. When investigating flicker complaints, utility personnel should include the IEEE 1453 Flicker Meter measurement when selecting initialization settings for power quality recorders. At the current time, IEEE 1453 standard has achieved broad acceptance and use, and as time goes on an increasing number of electric utilities are incorporating the improved method into standard practices for evaluating light flicker issues.
