Abstract
IEEE 519 specifies the measurement technique and limits for harmonics in a wide variety of locations, from transmission through distribution. For the first time, the 2014 edition also provides separate limits for low voltage secondary locations (under 1 kV). The modifications to the standard and the monitoring techniques specific to secondary harmonic monitoring, specifically residential locations, are described here. Also, recommended PQ analyzer settings are shown for this application.
Monitoring Location and the Point of Common Coupling
There are two major changes in the 2014 update to IEEE 519 that impact residential monitoring: choice of measurement location, and the harmonic limits for secondary systems. The first, choice of measurement location, is especially important here due to the likelihood of multiple customers sharing the same transformer secondary. The standard defines the point of common coupling (PCC) as:
Point on a public power supply system, electrically nearest to a particular load, at which other loads are, or could be, connected. The PCC is a point located upstream of the considered installation.
It’s also referred to in the standard as “the point in the power system closest to the user where the system owner or operator could offer service to another user”. IEEE 519 specifies that monitoring take place at the PCC. In a residential situation, this would typically be the secondary of the distribution transformer. The customer meter base, while a convenient location, is not a PCC except possibly in some duplex houses with separate meters on the same service drop. From a voltage monitoring standpoint, the only difference between those two locations is the service drop – generally the harmonic content would be lower at the transformer, as the monitoring point moves upstream. From a current monitoring perspective, the transformer secondary includes harmonic current readings from all customers on that secondary rather than just one that would be measured at a specific meter base. Since the current harmonic limits are scaled relative to the maximum demand and short circuit current (both of which are tied to the transformer size and its total load), a recording at the transformer provides data much closer in intent to the 519 standard for current.
Residential locations with only one customer on a transformer present an interesting case. In a larger commercial/industrial situation, a transformer is only intended to supply one customer. A new customer would get a separate transformer, so the PCC according to the strict definition above is on the primary side – the closest electrical point in common. In residential situations, if a neighboring customer could be fed from the existing transformer, the secondary could be considered the PCC. The difference between the primary and secondary location, apart from the difficulty in monitoring the primary side, is the transformer impedance. Including the transformer impedance in the monitoring point will significantly change the short circuit current, and thus change the harmonic limits (making them more strict on the secondary). The conservative practice is to include the transformer, and therefore monitor at the secondary in a residential situation even if only one customer is supplied.
Applying thresholds to data recorded at the meter base will be even more conservative for voltage, as the harmonic content will, if anything, generally be higher further from the supply source. In residential situations, especially in mixed-zone areas where industrial loads may be on the same circuit as customer homes, the residential load may not be the main source of harmonics. Here monitoring at a residential meter base should be fine for voltage, since the current measurements are not as important.
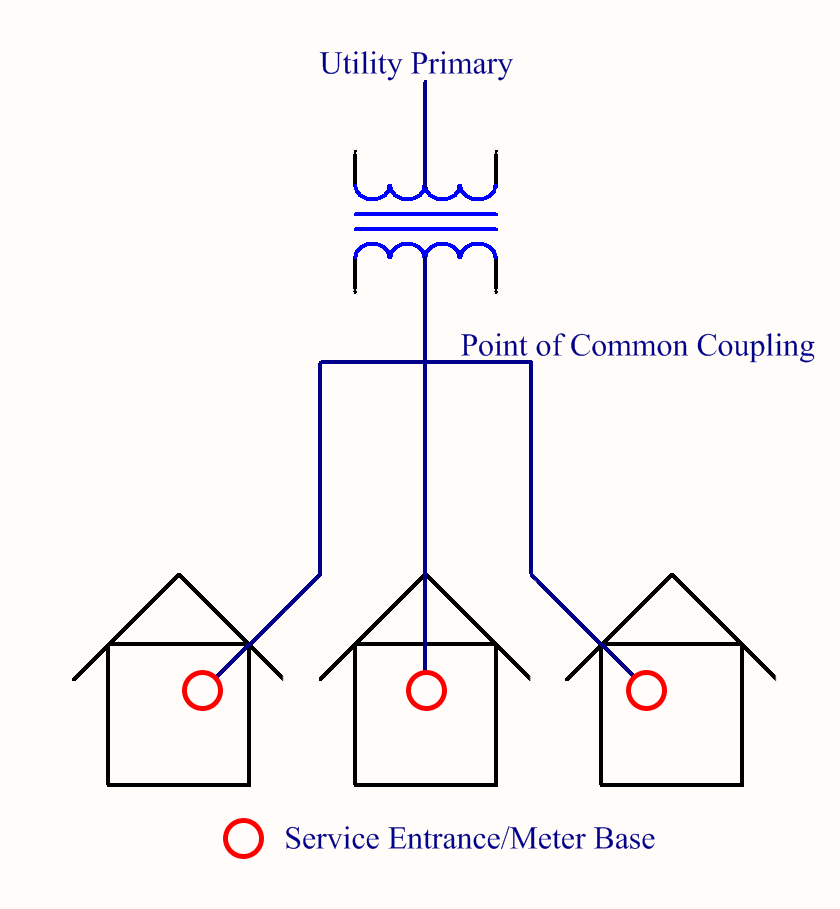
The possible connection points are shown in Figure 1 – the transformer primary, the secondary (PCC), or at the meter base/service entrance of each residential customer.
Recorder Setup
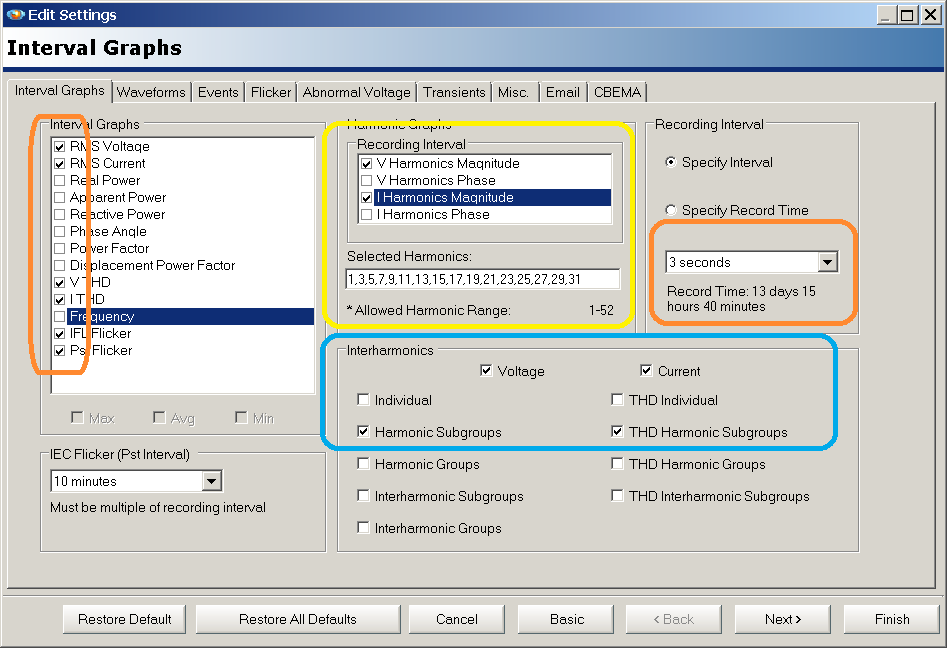
The key measurement type for IEEE 519 compliance is interval data. The recommended setup is shown in Figure 2. At a minimum, voltage and current THD, along with the 1st harmonic should be logged at the IEEE short time period of 3 seconds. The stripchart settings for RMS voltage, current, THDs, and the interval are shown outlined in orange in Figure 2. The individual harmonics to record are outlined in yellow – here the odds through the 31st are marked for individual stripchart recording. The 1st harmonic is the most important to log, as it’s required for Total Demand Distortion (TDD) computations. If using a Revolution interharmonics may also be recorded. This section is outlined in blue, and here the harmonic subgroups are set to record, along with the subgroup THD. The recommended recording time in the standard is 1 week. If using a cell Guardian reporting to PQ Canvass, or a cell Revolution downloaded remotely by ProVision, there is no real local recorder memory limit. Otherwise, the enabled stripcharts should be limited if needed to ensure the recording will span at least 1 week at the 3 second interval.
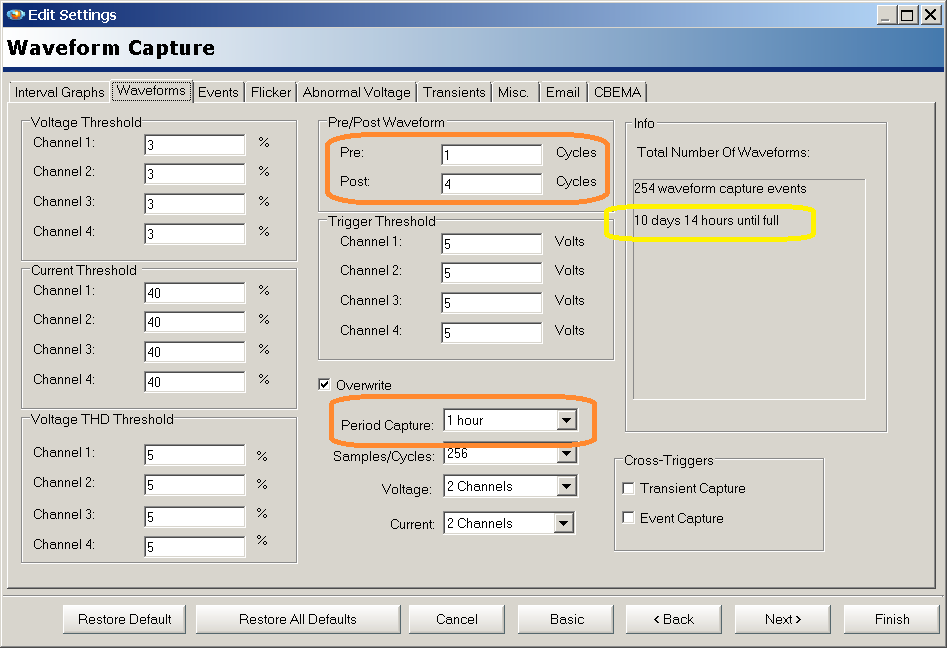
Waveform capture is also useful for IEEE 519 studies, for two reasons. First, voltage notching is one component of the 519 standard, requiring a captured waveform for a full analysis. Second, periodic waveform capture may be used to flesh out harmonic details for specific harmonics that aren’t recorded explicitly with a stripchart. A recommended starting point is shown in Figure 3. Periodic triggering at 1 hour intervals is selected. These 1 hour waveform snapshots can each be used for a full 1-51 harmonic analysis, independently of the stripchart data. The number of pre- and post-cycles have been changed to one and four, respectively, to ensure that there is enough local memory to span at least 1 week. To allow for triggered waveforms, the settings (shown in orange) have been adjusted for 10 days of recording (as shown in the yellow section). Again, these local memory limits are not needed when using a cell Guardian or cell Revolution.
Analyzing the Data
Once the data has been collected, the harmonics must be checked against the IEEE 519 limits. To do this, the “very short time” (3 second) and “short time” (10 minute) harmonic values, voltage THD, and current TDD must be compared with the applicable set of limits in the standard. These limits vary depending on the bus voltage, and also Isc/IL ratio – the ratio of the short-circuit current to the maximum demand load current.
With the 3 second very short time readings, it’s possible to calculate the 10 minute short time readings with Excel, as shown in the whitepaper Computing IEEE 519-2014 Short-Term Harmonic Values, and also the 99th and 95th percentile values. Alternatively, a separate recording can be made with a 10 minute stripchart limit so both data sets are available within ProVision.
The voltage limits are easier to work with. In a residential location on the transformer secondary, the bus voltage is always under 1 kV. Limits are the same for all individual harmonics, with a higher limit on the overall THD:
| Voltage | Individual Harmonic % | THD |
|---|---|---|
| Daily 99th percentile, 3 sec | 7.5% | 12.0% |
| Weekly 95th percentile, 10 min | 5.0% | 8.0% |
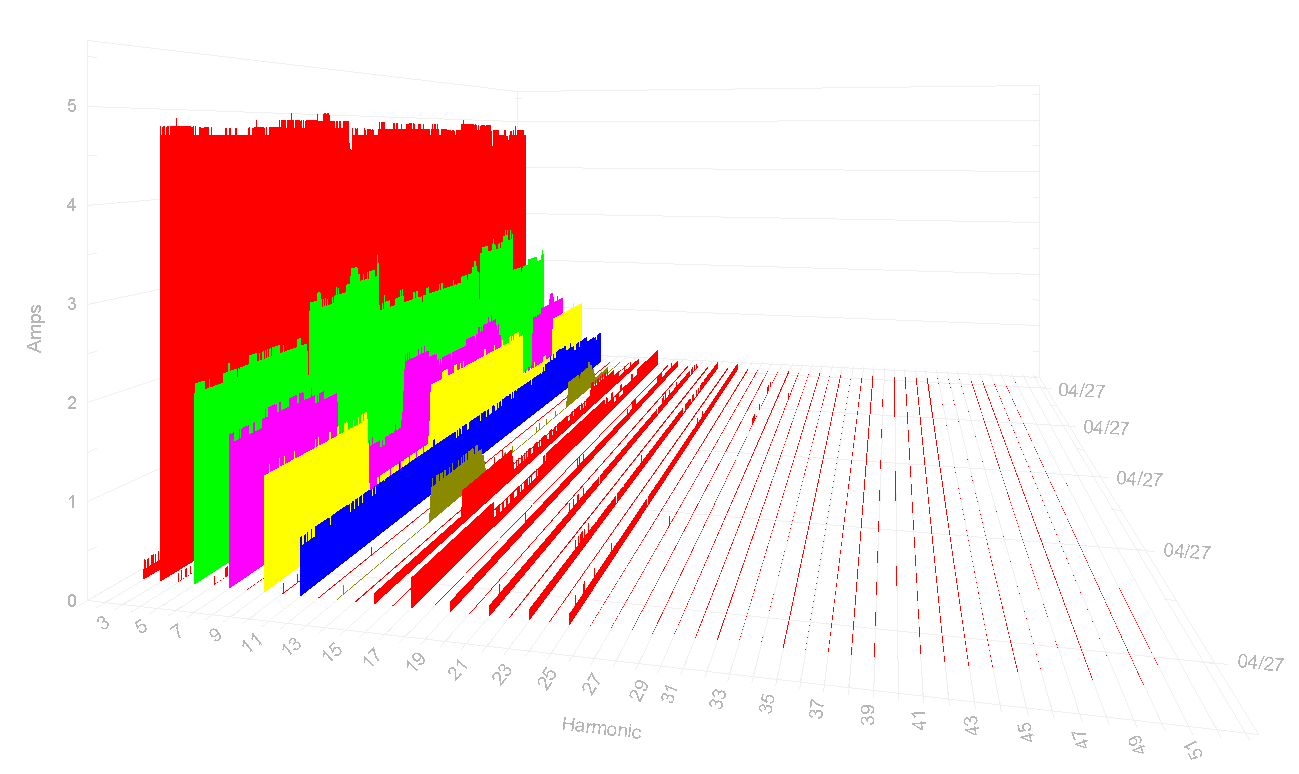
For the 3 second very short time readings, daily 99th percentile readings must be computed over a 1 day period. The 10 minute short time readings are used to compute 95th percentile figures over a 1 week period. In practice, the largest harmonic may be spotted using the ProVision 3D graph, and then analyzed in ProVision with an individual stripchart graph (as shown in Figure 4, for current). If no single data point is over the 7.5% or even 5% limit, then the percentiles will also be within the limit. Only in the case of the raw data exceeding a threshold is a more detailed analysis required to know if the percentile values are too high.
| Current | 3rd-10th | 11th-16th | 17th-22nd | 23rd-34th | 35th-50th | TDD |
|---|---|---|---|---|---|---|
| Daily 99th percentile, 3 sec | 8.0% | 4.0% | 3.0% | 1.2% | 0.6% | 10.0% |
| Weekly 99th percentile, 10 min | 6.0% | 3.0% | 2.3% | 0.9% | 0.5% | 7.5% |
| Weekly 95th percentile, 10 min | 4.0% | 2.0% | 1.5% | 0.6% | 0.3% | 5.0% |
The tables are more complex for current. In residential situations the actual load current may not be a significant contributor of harmonics – in many situations, the investigation at a residential level is to determine the impact of voltage harmonics on a customer, not the customer’s harmonic contribution to the system harmonics (with the notable exception of distributed generation issues). But for situations requiring an IEEE 519 current harmonic analysis, the details are given below.
Separate limits are given for 5 different Isc/IL ratios, and 5 different groups of harmonics. A single table of thresholds is given with multipliers for the different percentiles. To consolidate this, the thresholds from Table 2 of IEEE 519-2014 in the typical residential load situation (Isc/IL < 20) is presented above in Table 2, as an example.
Three sets of percentiles are needed instead of two for the voltage case. The individual harmonics are more complex due to the separate thresholds for various groups, but a quick check can be made with the 3D ProVision graphs by eye before requiring a percentile analysis (as shown in Figure 4). For current, the even harmonic thresholds are 25% of the values shown in the table above. A further complication is that the harmonic thresholds shown are in percent of the maximum demand current IL. To view the harmonic graphs and reports as percentages in this scale directly in ProVision, enter a current scale factor of 100/IL to get units of percent of IL.
In addition to the individual harmonic limits, TDD is used for an aggregate distortion limit. ProVision will compute TDD automatically with a specified maximum demand current IL. Once computed, TDD limits may be checked on the ProVision stripchart graph, or exported to Excel for a percentile analysis if required based on the raw data.
For a more cursory examination, the voltage THD and current TDD may be recorded and analyzed as per IEEE 519 with stripchart data, while the periodic waveforms are used for spot checking individual harmonics. The whitepaper Harmonics from Periodic Waveform Capture Data describes this process in detail.
Conclusion
IEEE 519-2014 presents a new, more rigorous method for analyzing system harmonic levels. A stricter definition of the monitoring location, and detailed tables for bus voltages and impedances present changes for harmonic monitoring in residential locations. Recommended PQ analyzer settings, monitoring location, and adjusted threshold tables have been shown here specifically for residential studies.
