Abstract
In this white paper methods for determining sources of voltage sag are discussed, as well as some example files that have identifiable sources of voltage sag. When placing a recorder to identify a specific problem, it is necessary to have the settings altered to capture the parameters needed to find the source. In order to capture and identify voltage sag causes, we must first consider the recorder settings. The most useful parameters in identifying such issues are the Voltage and Current intervals, single cycle histograms, and waveform captures. It is HIGHLY recommended to always record current in every recording session. The high emphasis on the current measurement is necessary because the voltage recording alone is basically useless in identifying the cause of an issue. The current signature is representative of customer load and can be used to differentiate between customer load issues and power sourcing issues. Discussed below are examples of Voltage Sag issues and the settings used to capture them.
Useful Settings
Voltage: Necessary for determining when voltage is above or below nominal
Current: Necessary for determining cause of the issue (customer load or source)
Interval: Interval Graphs are useful in seeing the big picture of captured recording. At a glance it is possible to determine the max, min, ave quantities and correlate them to a specific event. The interval graph makes it possible to determine customer load issues vs. source issues.
Waveform Capture: Waveform capture is a useful tool to “zoom” in on the captured event and see what the cycle by cycle waveforms look like during the event. This allows you to determine the severity and what the cause of the event might have been.
RMS Capture: RMS capture is a useful tool in determining the change of the RMS value over a fixed period of time. RMS capture is generated from waveform capture samples for voltage and current. The RMS Capture graph is a powerful method to visualize RMS changes in voltage and current, giving waveform-like detail without the inherent scaling issues of looking at raw sine waves.
Single Cycle Histograms: Similar to Interval data, single cycle histograms make it possible to determine the severity of voltage fluctuations on a cycle-by-cycle basis. Histograms are useful for determining the cycle RMS voltages during a recording session.
Interval Examples
In the example shown in Figure 1, there is noticeable voltage sag on both legs of approximately 10 volts. This information is gathered from the min voltage interval point. The min voltage (dark green) is the lowest the voltage measured in the given interval period. Notice in the file the max current (pink line) spikes about every 20 minutes on both legs at the same interval that the voltage sagged. This tells us two things, the load must be causing the sag and it’s a 240v load. With further investigation we can conclude that the load is likely a motor. The inrush current and then the average running current happen quite often during the day and could be some type of heating system.

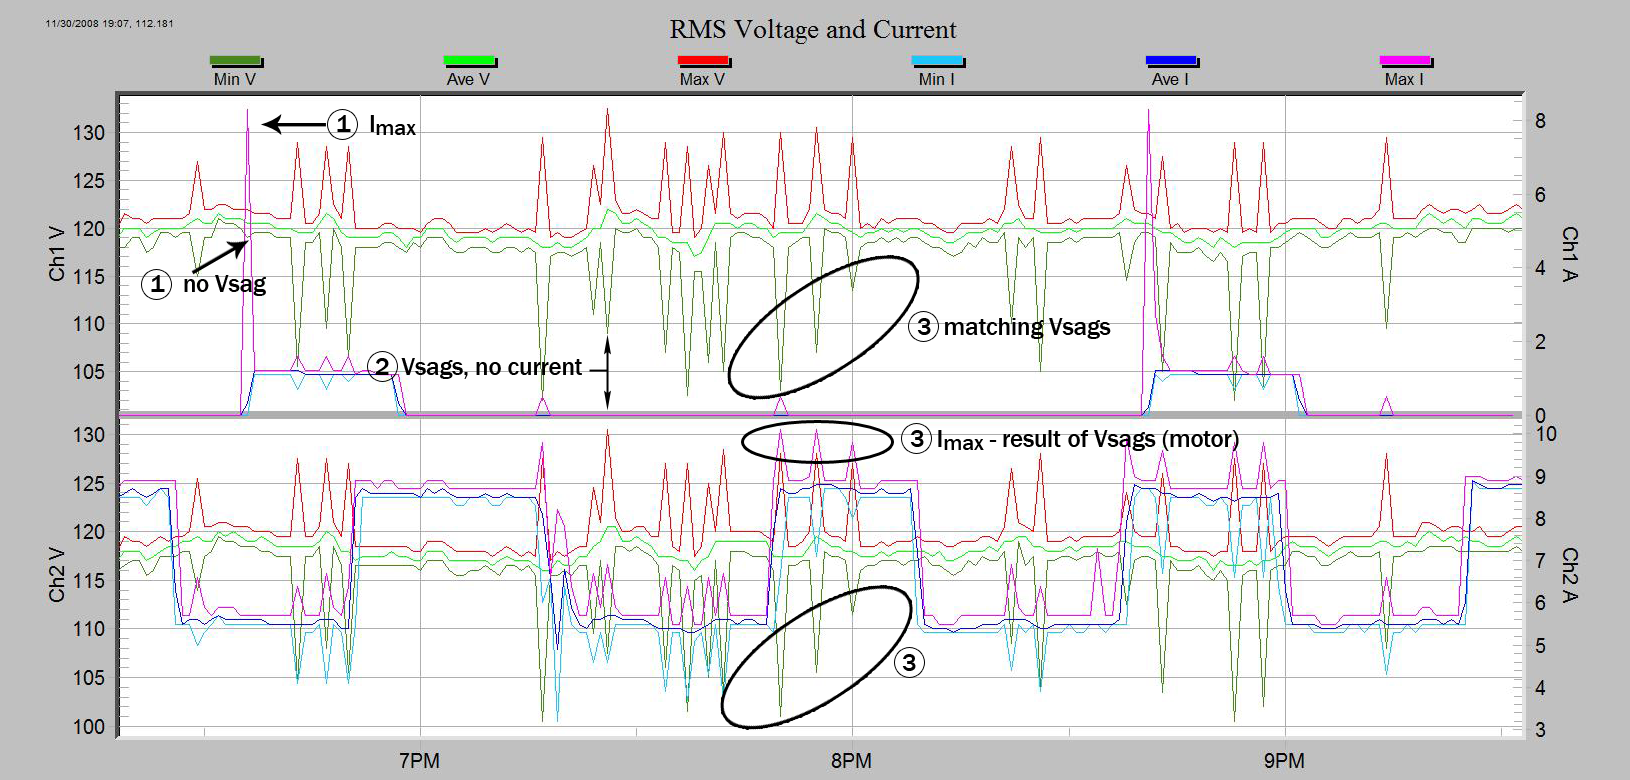
In the example shown in Figure 2, there are multiple issues happening over the course of the recording. Having multiple issues on the same plot can be very overwhelming. In the beginning of the recording at circle 1, there is a noticeable current spike on the max current plot. At the same interval period take a look at the min voltage plot and notice that the voltage is not affected by this spike? Also notice the min plot on the CH2 voltage tends to follow the CH1 characteristics. This indicates that the load is not affecting the voltage but there is still noticeable sag? Moving on to circle 2, a huge clue to add to the first investigation reveals voltage sag on CH1 with absolutely no load current? Although CH2 has current flowing, the characteristic of the load doesn’t appear to be affecting the voltage. Circle 3 reveals some interesting clues that also support our previous investigation. Take a look at the load current at 7pm on CH2 right before the voltage sags on both channels around circle 3. Notice the load current at 7pm didn’t affect the voltage at all but at 8pm the voltage fluctuates along with the current waveforms? The voltage fluctuation from the source on both channels is causing the load current to spike during each sag. There is supporting evidence that voltage from the source is poorly provided to this customer.
Waveform Capture Example
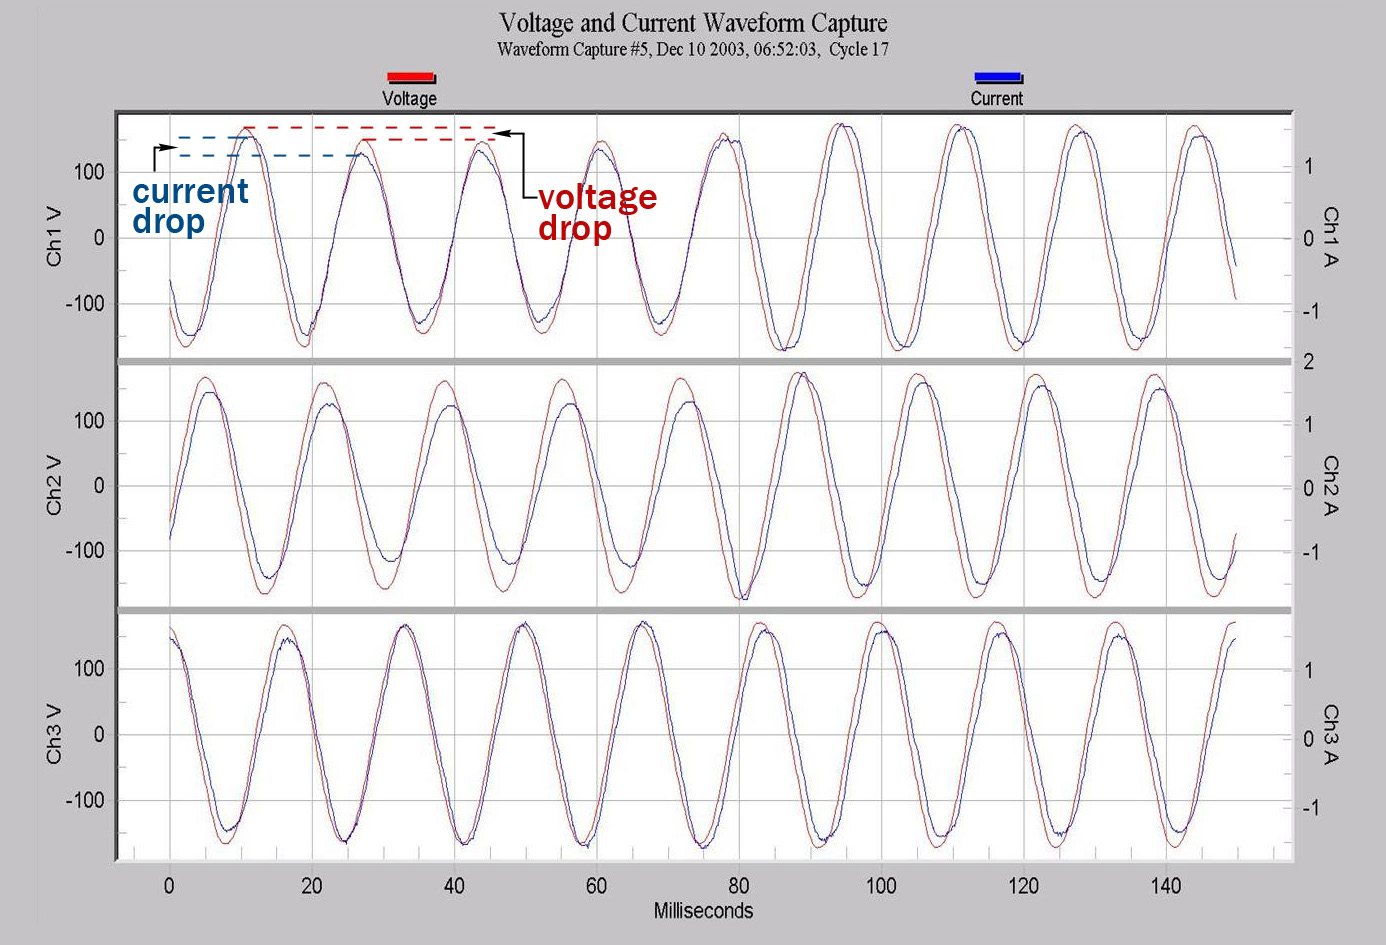
In the example shown in Figure 3, notice the voltage sag starting at the 2nd positive half cycle of the waveform. This would indicate some type of voltage fluctuation on the line but the cause is not evident until the current waveform is investigated. Take note of the current sags following the voltage fluctuation, this indicates that the load is following the source voltage and is not causing the sag. In a load induced voltage sag the load current would rise and the voltage would dip if the source was weak. Note: Voltage fluctuations are hard to identify with waveform capture due to the resolution of the plot. An alternative approach is using the RMS capture of the waveform as discussed in a later example.
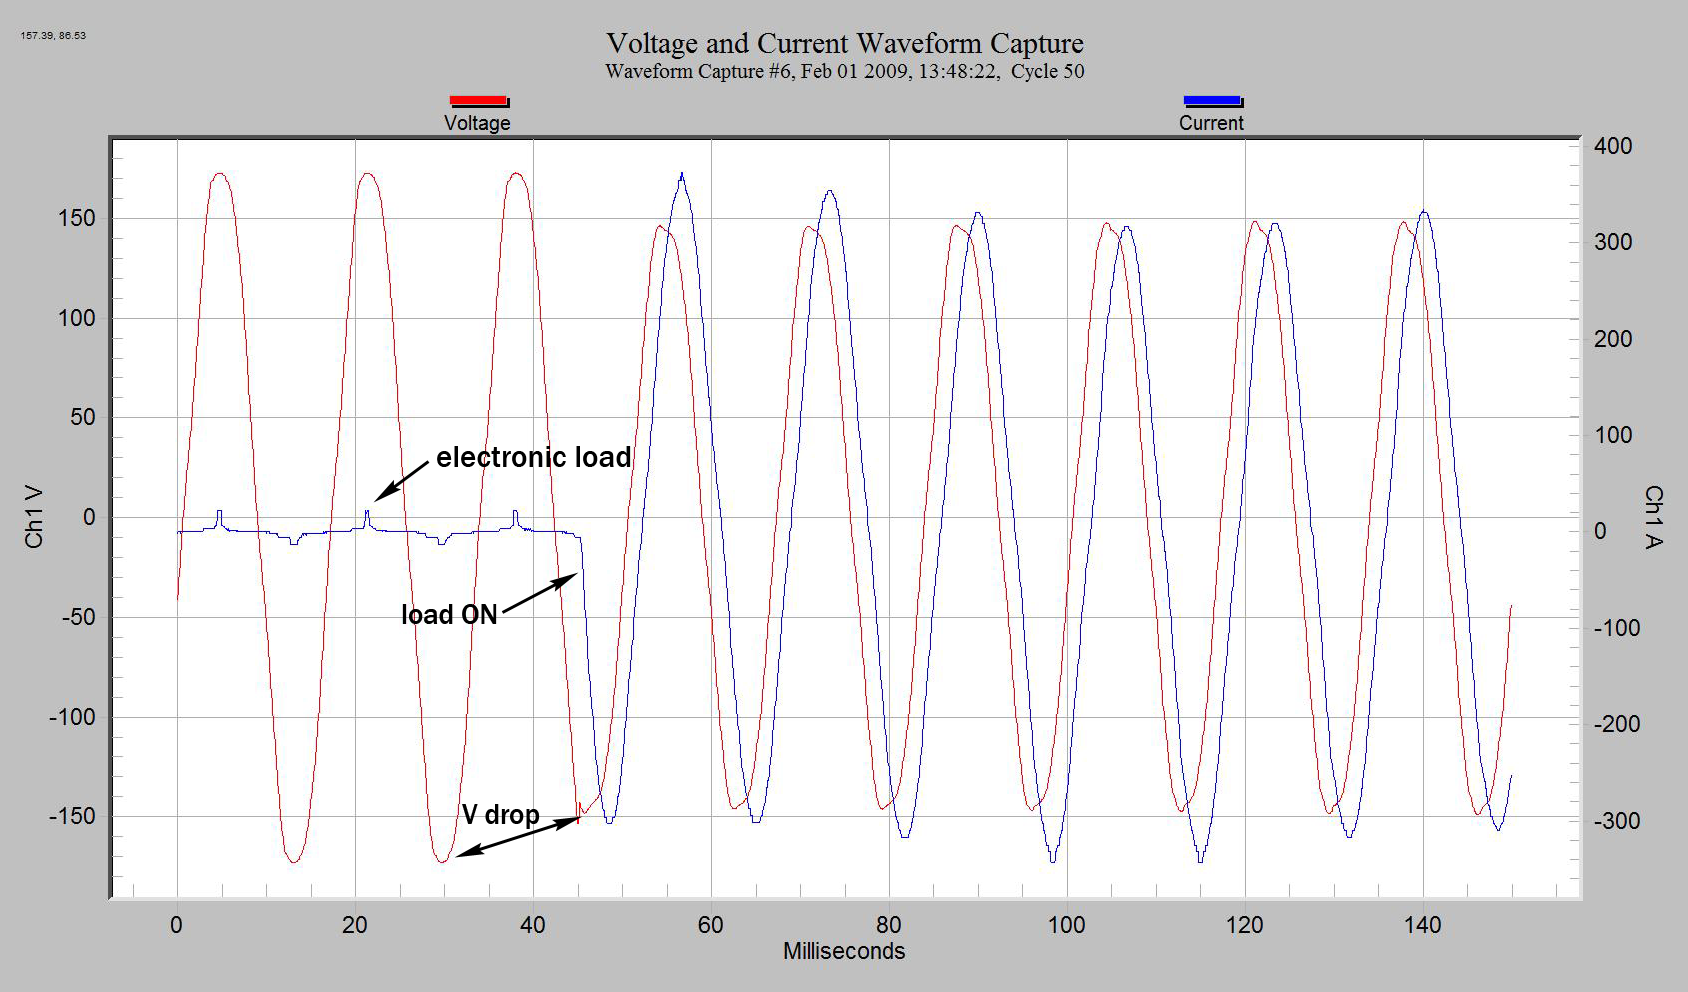
In the example shown in Figure 4, notice the small load on the first few cycles of the waveform capture. This load obviously has no effect on the voltage waveform and doesn’t appear to be the triggering source. Take a look at the next load to turn on at time 50ms; this appears to affect the voltage enough to cause an event. Notice the voltage sag from time 50ms to the end of the waveform capture? This event is caused by the high current load until the end of the waveform capture. The only things this doesn’t tell us is the duration of the event and what caused it, further investigation is needed; stripchart data might be useful.
RMS Capture
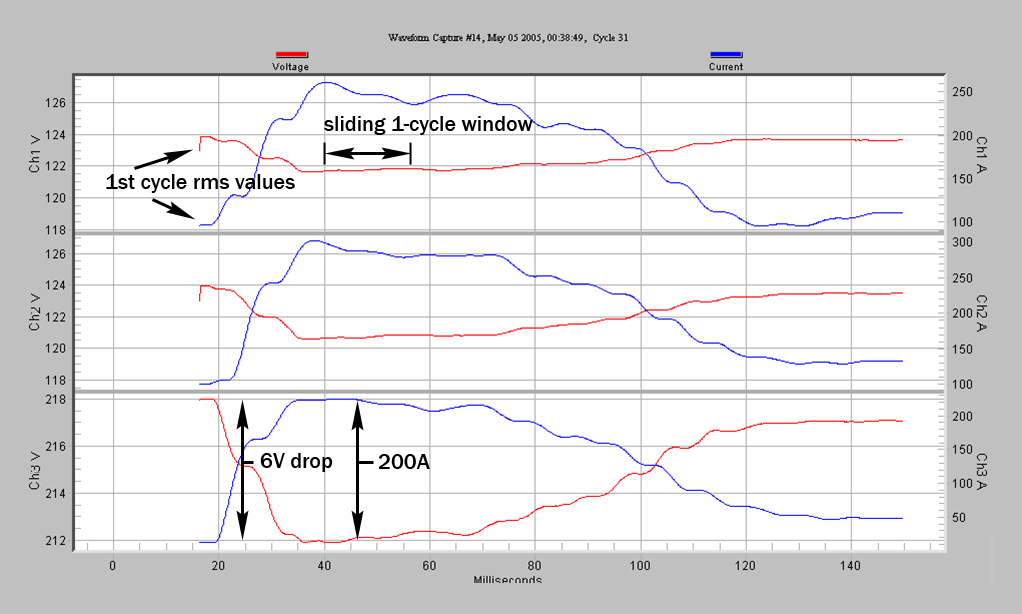
In the example shown in Figure 5 there is a very identifiable 3 phase load turn on at time 25ms. Although the sag is not very deep we can easily identify the source of the problem. Unlike the waveform capture, the RMS capture is a “zoomed” in version of the raw waveform data but in RMS form. We can see from the data the load induced sag only lasts a short period of time before the load settles to steady state. This load characteristic could be a polyphase motor of some type that has a large starting current but a relatively smaller running current. RMS capture is very handy for finding small RMS changes from the raw waveform data giving more detail than the Stripchart intervals.
Histograms
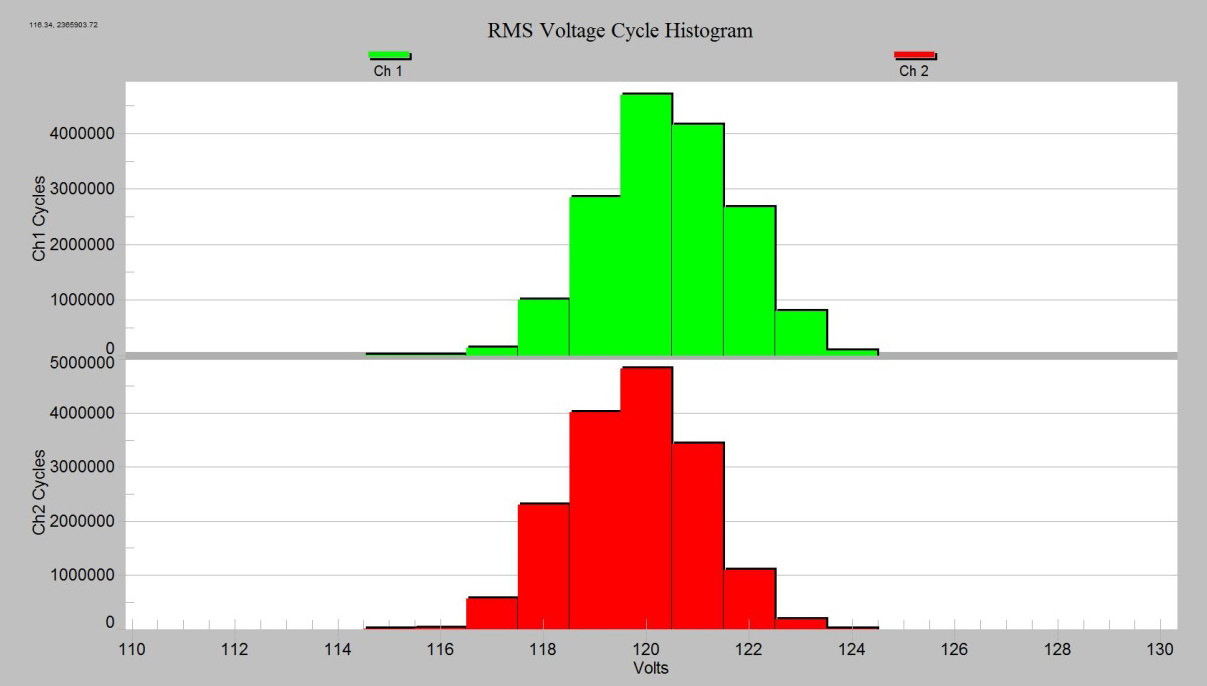
In the example shown in Figure 6, voltage sags and swells are easily evaluated over the entire recording session. Although the histograms are not as useful for determining source or load induced voltage fluctuations, you can quickly examine the overall voltage regulation. Histogram values are recorded on a cycle basis and are also useful for identifying frequency and magnitude of voltage fluctuations.
Conclusion
Identifying the source of voltage fluctuation is not always an easy objective. With a little knowledge and understanding in the representation of the voltage and current data, analysis can be a more manageable task.
