Abstract
Modern loads convert the utility AC voltage into DC for use internally; this process generates harmonic currents. Harmonic currents can necessitate transformer derating, introduce voltage distortion, and even cause false tripping of breakers. Analyzing a system for harmonics—which harmonics, when they are most prevalent, and where they are coming from—can be crucial to limiting distortion.
PQ Canvass shows harmonics in not only 2D graphs, but also 3D waterfall graphs to display the changes in a range of harmonics over time. Waterfall graphs display the data by order (x-axis), time (y-axis), magnitude (z-axis); presenting harmonics in a way as to illustrate which harmonics have the highest magnitudes, make changes in magnitude over time more apparent, and shows which harmonics warrant a more detailed analysis with 2D graphs. The 3D waterfall graph is a quick way to visualize all harmonics in a recording at once, letting the user see which harmonics are elevated – often only a few are high in any one situation. The quick 3D view helps the user narrow down the analysis which follows using the 2D graphs.
Harmonics Graphs
Certain loads within a system can introduce harmonics. By examining how the magnitudes of specific harmonic orders change over time, it becomes easier to identify which loads are contributing to harmonic distortion and pinpoint when the distortion is most severe.
As an example, a capacitor bank resonance can amplify harmonic voltage distortion at the resonant frequency, but only when the capacitor is energized. This effect is easy to spot in the 3D waterfall graph. In this case, simply looking at THD will hide which harmonics are the problem, as it is the combination of all harmonics present as a percentage of the fundamental—the specific individual harmonic magnitudes become lost in this computation.
Harmonics matter because it converts directly to avoidable losses, thermal stress, and mis-operation. Nonlinear loads inject frequency components that elevate RMS current, overheat transformers, excite capacitor bank resonances, and degrade motor performance. Identifying which harmonics and when they are occurring can help prevent shortened asset life and deploying personnel to repair or replace components.
An example usage of the waterfall graph can be seen in the following image: the voltage magnitudes of the 5th and 7th harmonics are higher than that of the 9th, but from December 24th to December 28th they drop below the 9th harmonic, after which they resume their prior magnitude position relative to the 9th harmonic.
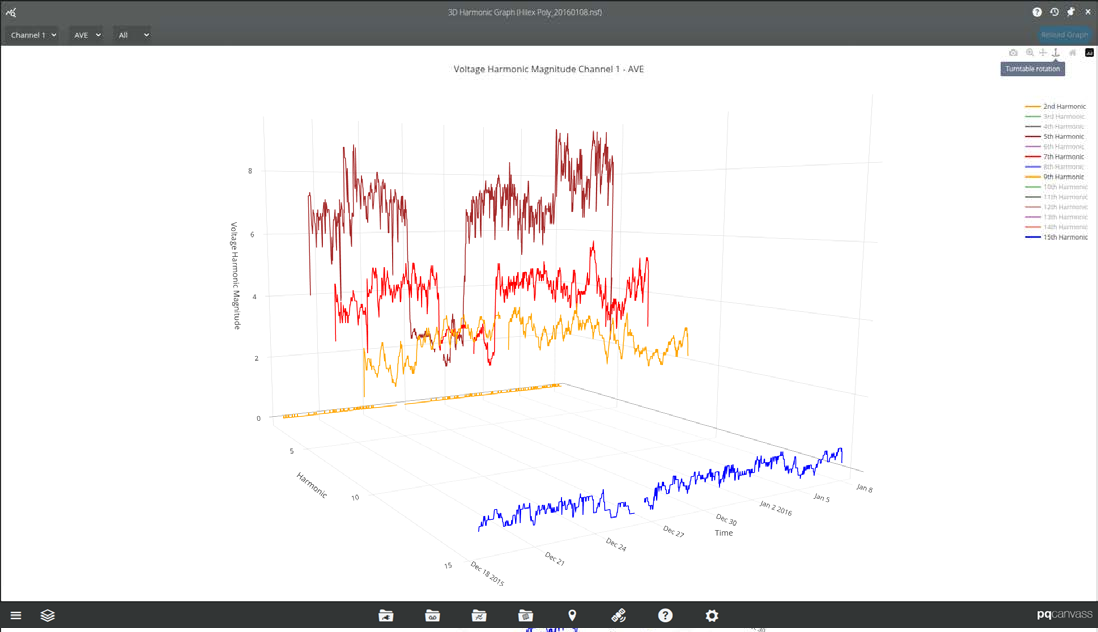
Using a waterfall graph, one can quickly see that it was the 5th and 7th harmonics, not every harmonic, that were affected in that way.
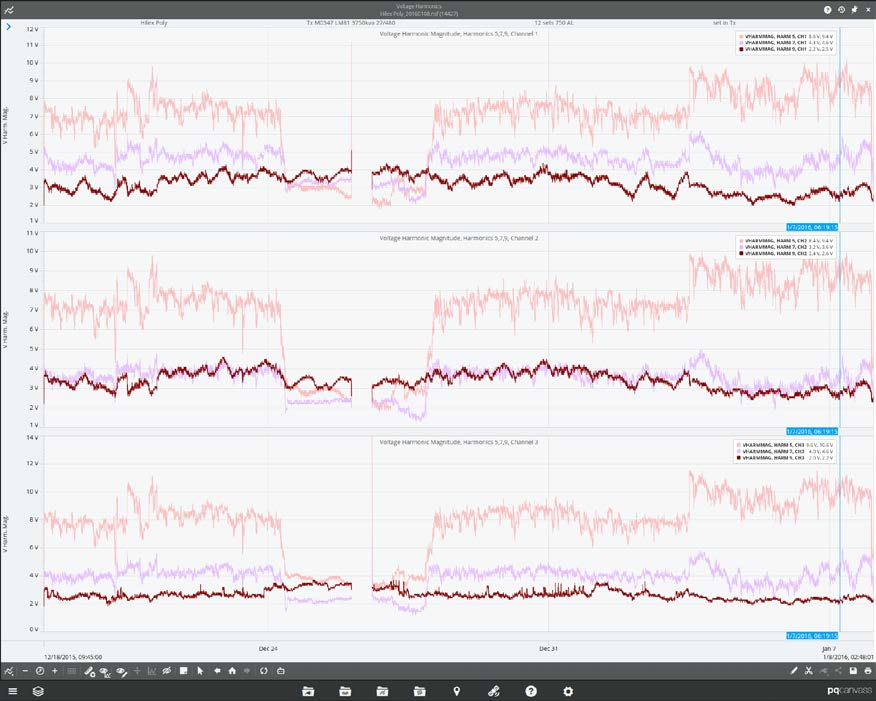
The harmonics stripchart graph is useful for more granular analysis, and works as a worthy complement to the waterfall graph. As particular harmonics have been identified as worthy of further investigation, viewing them is just as simple as viewing the waterfall graph.
To do so, click on “Voltage Harmonic Magnitude” or “Current Harmonic Magnitude” in the recording to open the harmonic selector. For our prior example, selecting 5th, 7th, and 9th harmonics will present the average traces for those harmonics on plots for each channel. Once in the stripchart graph, we can see what the magnitudes were when the 5th and 7th harmonics dropped below the 9th harmonic on channel 1.
PQ Canvass
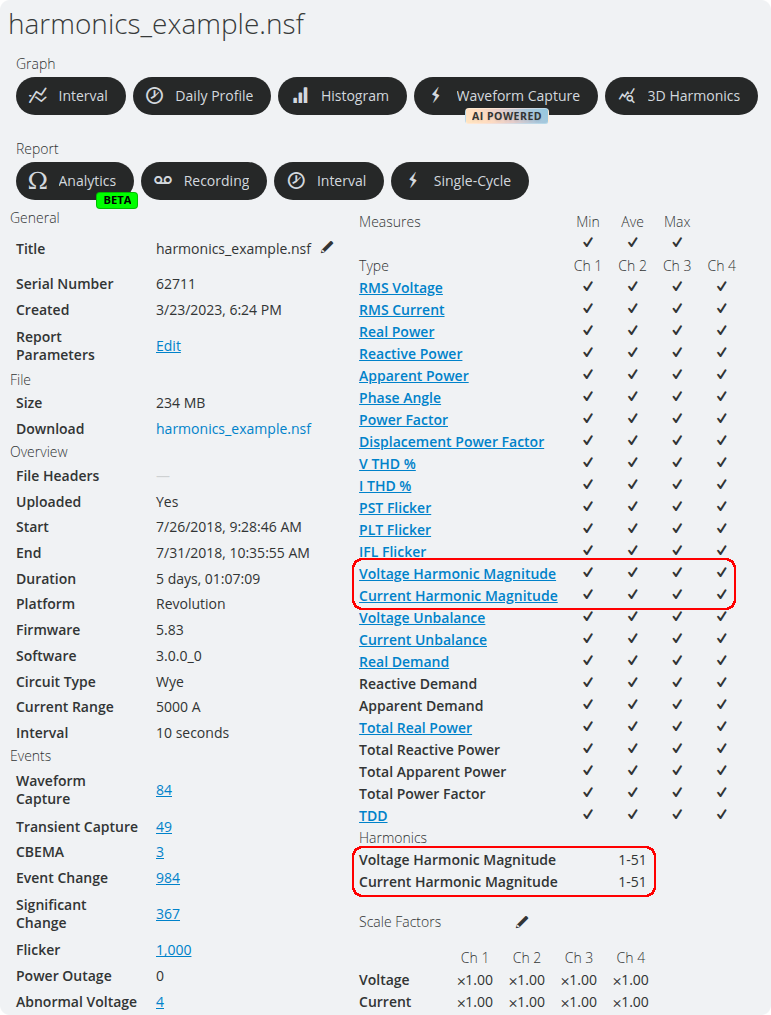
Using a PMI recorder capable of measuring harmonics (such as Seeker or a Bolt) and enabling harmonics in the recording gives one the capability to view the 3D waterfall harmonics graph in PQ Canvass for either voltage or current harmonic magnitudes.
To view harmonics graphs in PQ Canvass, navigate to a device’s recording that has harmonics enabled and click 3D Harmonics. The list of available measure templates will be presented.
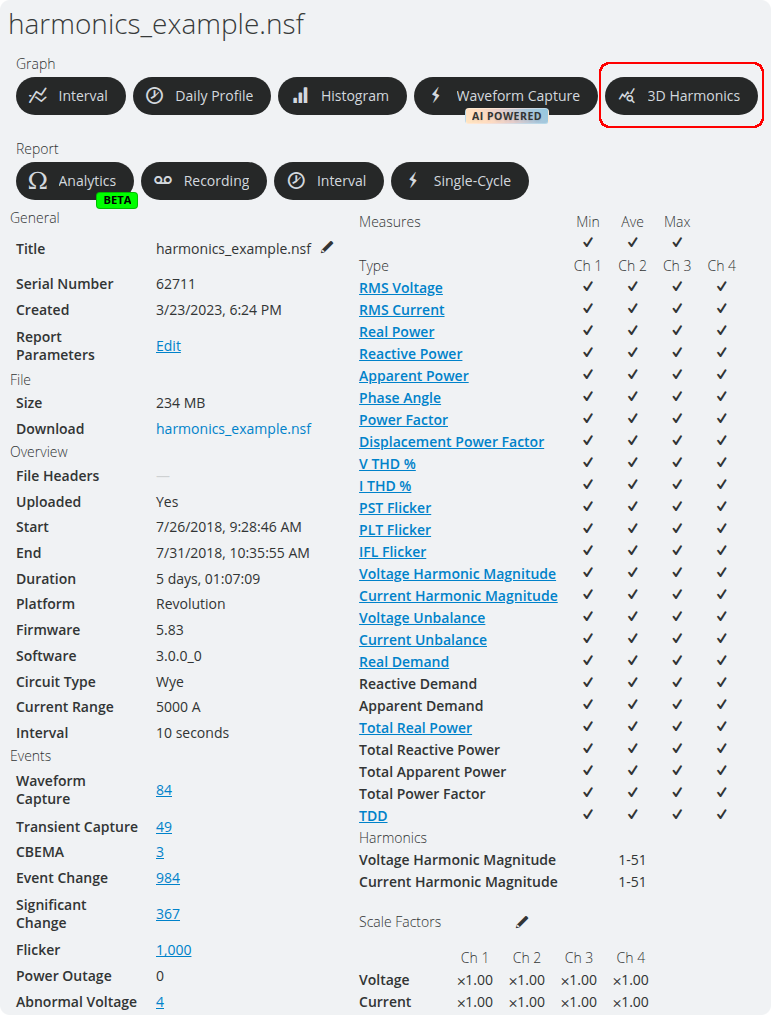
Note that harmonics must have been selected and voltage and/or current magnitudes enabled for any 3D harmonics measure templates to be accessible. If they are not, the recorder will need to be re-initialized with those settings enabled.
Using the Waterfall Graph
Being able to use waterfall graphs to their maximum potential means knowing how to manipulate them in PQ Canvass.
Shifting and rotating the graph can give the best angle to understand where one harmonic relates to another, and can help to focus on specific data when looking into a particular issue.
Rotation is done by holding shift and the left mouse button down and moving the mouse. This can also be done by moving the mouse with the left mouse button held down, or dragging on a touch enabled device, when the “Turntable rotation” tool is selected in the upper right.
Zooming is done by using the mouse wheel, or holding down the middle mouse button down and moving the mouse up and down. This can also be done by moving the mouse with the left mouse button held down, or dragging on a touch enabled device, when the “Zoom” tool is selected in the upper-right.
Panning is done by holding the right mouse button down and moving the mouse. This can also be done by moving the mouse with the left mouse button held down, or dragging on a touch enabled device, when the “Pan” tool is selected in the upper-right.
You can also toggle individual harmonic trace’s visibility by clicking on the trace in the color legend on the right side of the view, as well as create screenshots of graphs with the current view-port using the camera tool.
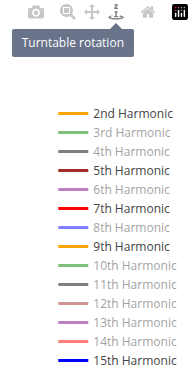
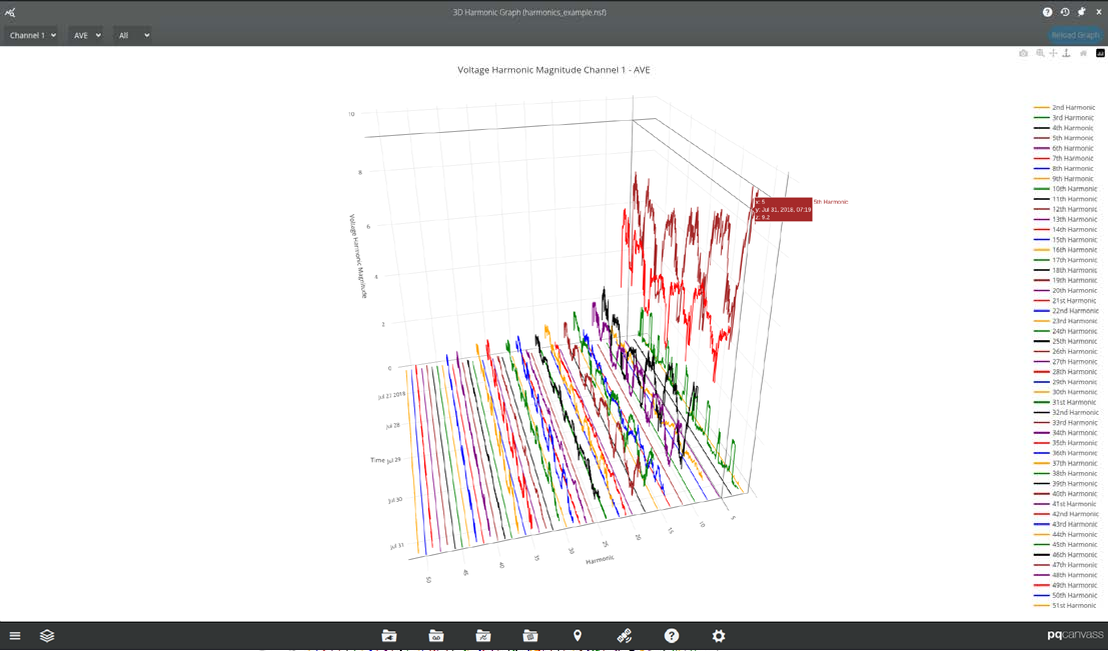
When the mouse is placed over a harmonic trace, the legend displays the harmonic number of the trace, the date and time of that point, and the magnitude. Lines are also drawn to the x-, y-, and z-axis from the point. Harmonic orders are also colored to assist in differentiating them from one another at more oblique angles.
To select a different channel, make any selections desired in the upper-left and click “Reload Graph” in the upper-right.
Conclusion
As a system’s complexity increases, the need to examine such a system for the introduction and source of harmonics also increases in-kind. Using 3D harmonics graphs expose trends and possible non-compliance, presenting the data in such a way as to make these more easily apparent much quicker than looking at THD alone, or going through many 2D graphs to check all 50 harmonics.
PQ Canvass provides many ways to examine power quality and harmonics of a system. The 3D waterfall graph is a powerful addition to present this data in a clear, concise, and interactive way for quick and insightful analysis—providing the groundwork for a much more detailed investigation of specific harmonics as stripcharts, if warranted.
