Abstract
Power networks have become increasingly more complex with the rapid growth of non-linear loads. These additions place significant burden on a network, resulting in a reexamination of today’s installations. This whitepaper briefly overviews some power quality basics including: power factor, harmonics, and power factor correction capacitors.
Understanding Power Factor Correction
Since the turn of the 20th century, power factor correction (PFC) techniques have been in wide use to improve power efficiencies. It is commonplace among industrial and commercial settings with large inductive loads to deploy PFC. End-user’s whose electrical network exhibit low power factor (PF) can see significant cost savings by avoiding electric-utility PF penalties. PFC is often referred to as an energy cost reduction measure. However, this is a common misconception. Cost savings are primarily achieved by mitigating PF penalties. Electric utilities promote energy efficiency to reduce their system loses. PF improvement frees capacity on the electrical distribution system, increases voltage levels, and decreases demand on transformers.
Power Factor Basics
There are three basic types of power: real power, reactive power, and apparent power. Real power, measured in kilowatts (kW), is responsible for the actual “work” being performed. Reactive power, measured in kilovolt-amperes-reactive (kVAR), does not contribute to the “work”, but circulates between the source and load. It represents stored and released magnetic energy or electrostatic energy from its respective inductive or capacitive properties of the circuit. Apparent power, measured in kilovolt-amperes (kVA), is the relationship between real power and reactive power.
PF is the ratio between real power and apparent power, illustrated in Equation 1. It expresses how effectively electrical power is being utilized. A load with a higher PF will generally consume less current than a load with a lower PF for the same work.
Improving PF
In a linear load, PF arises with the existence of a phase angle (φ) between the instantaneous current and voltage. An inductive circuit causes current to lag voltage, while a capacitive circuit causes current to lead voltage. Under this notion, carefully matched capacitors (PFC capacitors) can mitigate the low PF caused by inductive loads.
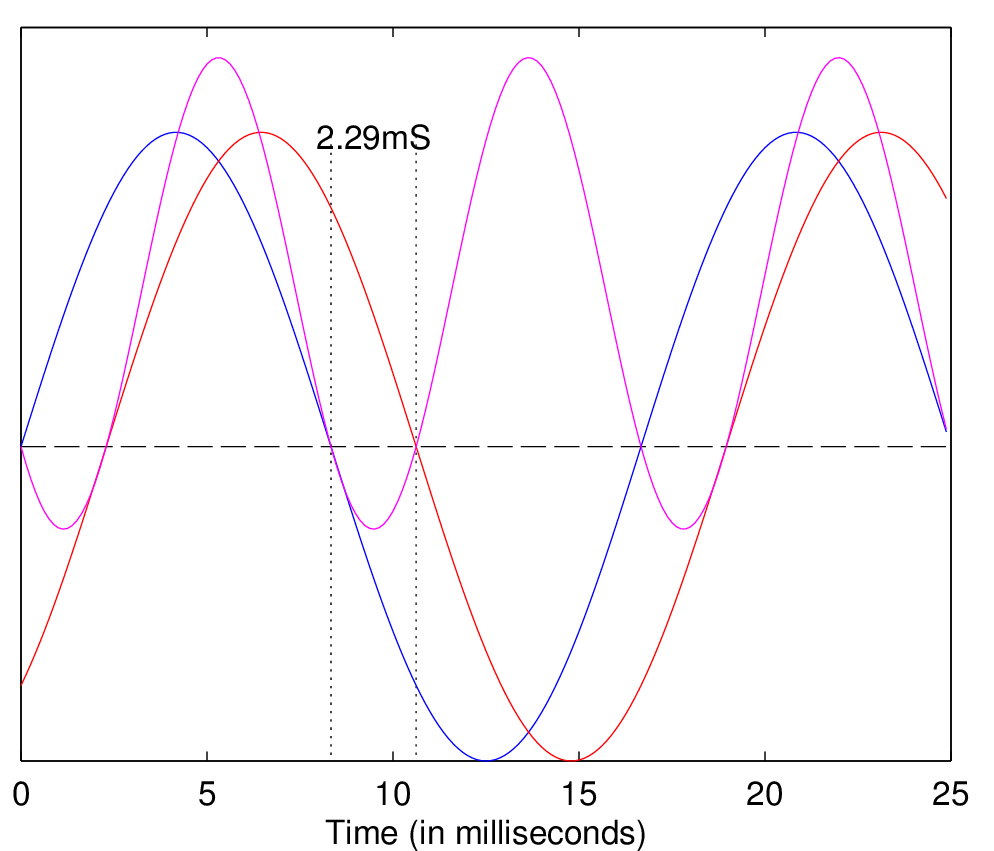
Consider Figure 1, it demonstrates a 60Hz single-phase system where current lags voltage by Δt ≈ 2.29mS. (Note it is often easier to measure the phase delay at the zero crossing rather than at the peak.)
Equation 2.
Utilizing both Equations 1 and 2, we can compute the exact PF. We first convert the known time delay into a phase angle. From here, we take the cosine of the newly found phase angle to find PF.
We arrive with a PF ≈ 0.65 at this instance.
Now, let’s assume this system was a motor operating at 400V with 60A current draw, and we have a desired PF = 0.95. Doing so requires a PFC capacitor in parallel with the load to bring the current and voltage waveforms closer to unity. (That is, we require a PFC capacitor to shift the current waveform to the left.) Determining the desired capacitance requires a few steps be taken. First, the system’s real power must be calculated (Equation 3).
Equation 3.
With the real power calculated, the required capacitance in kVAR can be obtained. This is done by multiplying real power by the difference between the tangent of the actual and required phase angle (Equation 4).
Equation 4.
The last step involves a simple translation to convert kVAR into Farads, as shown in Equation 5.
Equation 5.
The final solution approximates 217μF as the desired PFC capacitor size. Unfortunately, there are some caveats with this implementation. Resonance within the circuit will often occur when an inductive impedance is mitigated by a capacitor, such as in this example. This can increase unwanted noise and harmonics within the system, which will be further discussed in this paper.
Harmonic Distortion
Harmonics have become an important consideration in the utility industry. Up until the 1980s, loads were generally considered linear. That is, current had a direct response to the voltage applied. A resistor is one example.
Harmonics can be produced by over saturating the magnetic core of a transformer or by the switching action of switch mode power supply (SMPS), or by a variable frequency drive (VFD). The distortion can contribute to many problems within a power network. A few include: tripped breakers, blown fuses, excessive heat, and degradation to power equipment.
Overview of Harmonics
Integral multiples of the fundamental frequency make up the composition of harmonics. All periodic complex waveforms can be expressed in terms of superimposed waveforms at varying frequencies. Therefore, harmonic distortion can be quantified by the sum of odd and even multiples of the fundamental power frequency (i.e. 60Hz in the US). This constitutes harmonic frequencies at 120Hz, 180Hz, 240Hz, and so forth. It is important to note that harmonics are steady-state and are completely different than instantaneous line surges, sags, and spikes, which are not sustained, periodic distortions to the waveform.
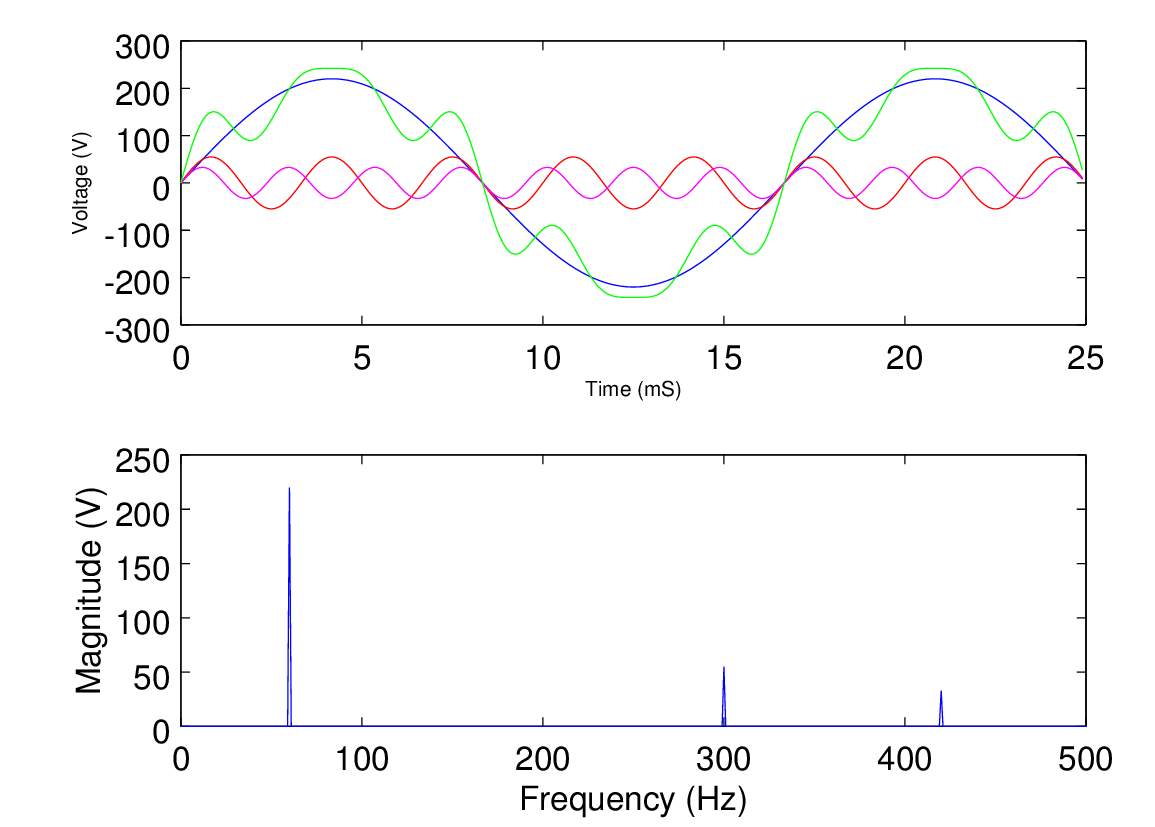
Figure 2 demonstrates how harmonics can affect the power waveform, specifically the 5th and 7th harmonic. In this example, the magnitudes are overemphasized to improve the illustration. It is possible to quantify the total harmonic distortion (THD) as shown in the generic Equation 6. The first step requires deconstruction of the complex waveform, which generally involves performing a Fourier Transform. This produces the decomposition of the complex waveform, providing the magnitude and frequency of each harmonic. However, this procedure is beyond the scope of the whitepaper, and thus has already been performed for us. We can visually inspect the bottom Figure 2 to glean the necessary information.
Equation 6.
In this particular example, we are only dealing with instantaneous voltage values. Following Equation 6, we first take the square of the peak voltages of each harmonic (the 5th at 55VPEAK and the 7th at 33VPEAK) and sum them together. Afterwards, we take the square root of the sum of squares and divide by our voltage at our fundamental frequency (60Hz at 220VPEAK).
The extreme solution produces THDV = 29.2%, which is well beyond the percentage recommended within IEEE Standard 519. The limits herein are defined as no greater than 5% for THD and no greater than 3% for any individual harmonic. It is worth noting that total voltage harmonics are usually much lower than 10%.
Harmonic Effects of PFC Capacitors
PFC capacitors are often selected to obtain the maximum cost savings. Doing so, designers can unknowingly amplify harmonics.
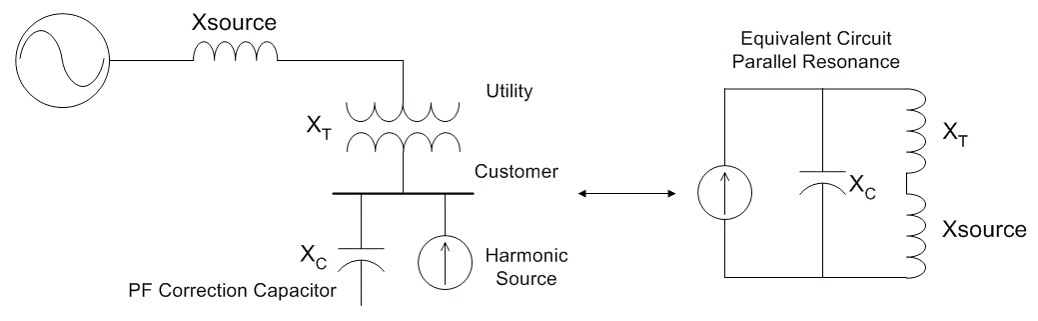
A monolithic representation is shown in Figure 3. The model assumes the total reactive load as inductive and harmonic sources are viewed as current sources. Typically, it is difficult to fully characterize this model, as the load composition is often not available, and in any case varies over time. It is good to note the parallel installation of the PFC capacitor and how it affects the circuit.
Resonance with System Impedance
A PFC capacitor applied to the system impedance can resonate with the power network elements. Circuit resonance presents itself at a frequency where the capacitive reactance reach equilibrium with the supply impedance, such that current and voltage phasors are in line. There will always exist a frequency where PFC capacitors contain a parallel resonance with the load and system inductance. The phenomenon can adversely affect system performance where the installation is near a harmonic source with frequencies close to the resonance. The effect causes large currents to flow through the capacitor leading to an overload.
Overloading PFC Capacitors
As we know the total current is the collective sum of the current branch. An inductor’s impedance (XL) increases with frequency, while a capacitor’s impedance (XC) decreases with frequency. This correlation is obvious when inspecting Equation 7. We observe that as frequency approaches infinity (f → ∞), the inductor’s impedance also approaches infinity (XL → ∞). Inversely, as frequency approaches infinity, the capacitor’s impedance approaches zero (XC → 0).
Equation 7.
This is an important notion, because a system’s impedance is generally considered inductive. Therefore, as harmonics move beyond the fundamental frequency, more current circulates through the PFC capacitors. The absorbed reactive current can exceed the capacitor’s maximum current tolerance, causing premature failure and blown fuses.
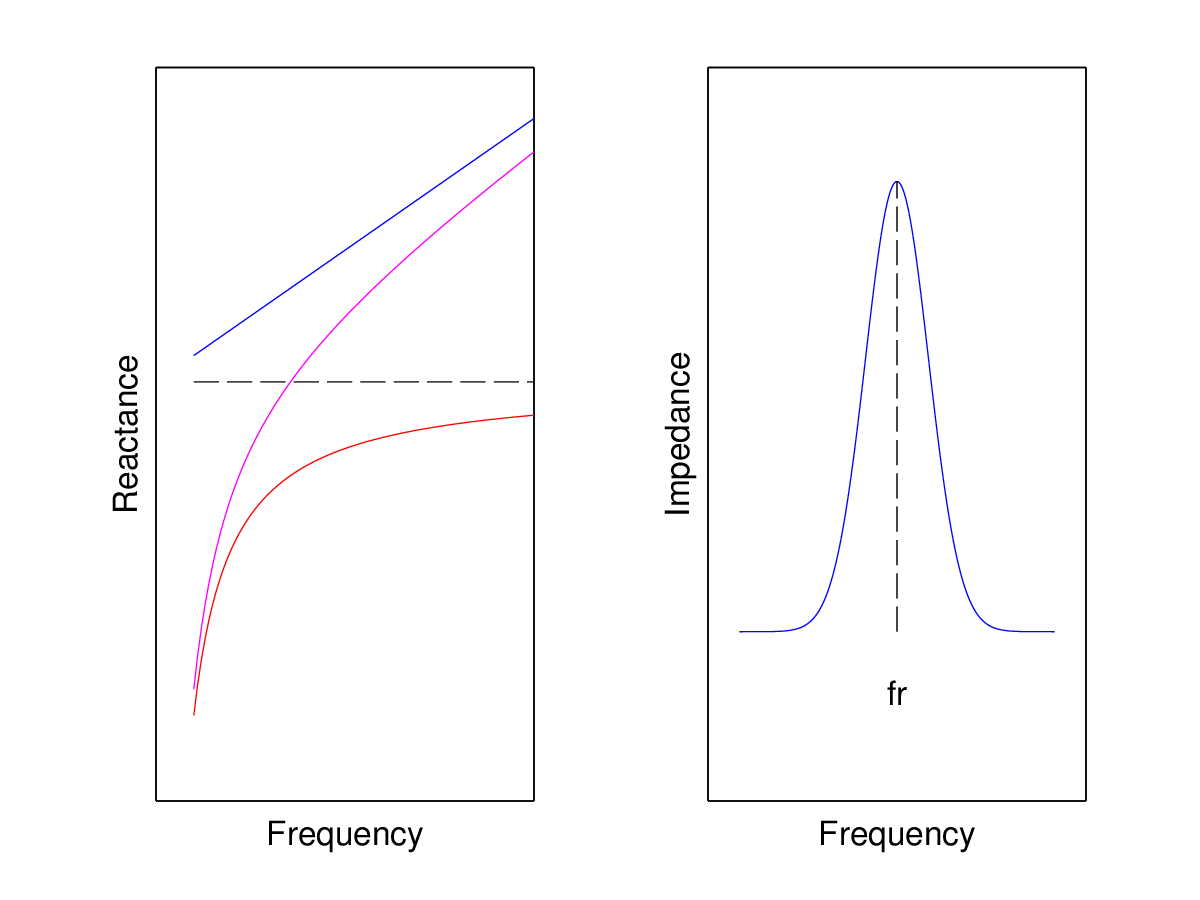
It is also possible for harmonics to produce significantly higher voltages than the fundamental signal. At resonance, the network reaches its maximum impedance, but the cumulative current remains constant. In turn, voltage across the parallel circuit follows the same shape as the impedance. This overvoltage can often surpass the capacitor’s maximum voltage tolerance.
Overcoming Resonance
There are multiple methods for overcoming resonance. Utilizing the systems natural impedance may reduce the effect of harmonics. Simply placing the capacitor at a location within the system that does not cause parallel resonance (Figure 4) with the supply can often mitigate the issue. Resonant frequency varies with kVAR rating of PFC capacitor. Adjusting the kVAR rating can shift the resonance point away from a harmonic generating device.
Harmonic Filtering
A common method to counteract resonance is to include a series reactor with the capacitor. The combined capacitive and reactor circuit should exhibit an inductive behavior at critical frequencies, while exhibiting a capacitive behavior at the fundamental frequency. Tuning the filter should be performed at the lowest order harmonic frequency. Typically this is found at the 5th harmonic, but this will vary depending on the magnitude and frequency of the present harmonics. It is worth noting the fundamental voltage will increase across the capacitor with the inclusion of a series reactor. This shunt filter will divert harmonic currents to ground, rather than through the distribution network.
If the harmonic current is too high for the power factor capacitor itself, another method is to use a band-stop filter, otherwise known as a notch filter with a high quality (Q) factor. In theory the filter responds with very high impedance at the tuned frequency, blocking all of the harmonic current. Together with the natural resistance of the circuit, very little harmonic current will flow through the load.
The effectiveness of the harmonic filter depends heavily on tuning accuracy, reactive output power, and network impedance. If multiple harmonics are present in the system, it is possible lower harmonics will be amplified. For example, a 7th order harmonic filter will magnify harmonics near the 5th harmonic. Therefore, it is often necessary to deploy multiple filters at each specific harmonic, shown in Figure 5.
Changes to a load can dramatically affect the filter performance. Whenever additions occur within the same network distribution, the harmonic filter needs to be reevaluated. It is generally bad practice to simply add multiple filters tuned to the same frequency, unless substantial impedance separates them. Due to slight variances, filters tuned to the same frequency will cause harmonic current to favor one over the other.
Harmonic Evaluation
The first step before installing any PFC equipment is to perform a full system analysis of the circuit involved. System supply impedance and current at each harmonic should be measured, and in particular at the location proposed for adding a PFC. PMI offers several products capable of providing extensive detail to address these issues.
PMI products with harmonic measurement capabilities, such as the Revolution, Eagle, and Guardian offer several means for capturing harmonic data. These measurements can be thoroughly analyzed using PMI’s ProVision software. The white paper titled Recording Harmonics overviews the basic setup for gathering data to perform a harmonic analysis.
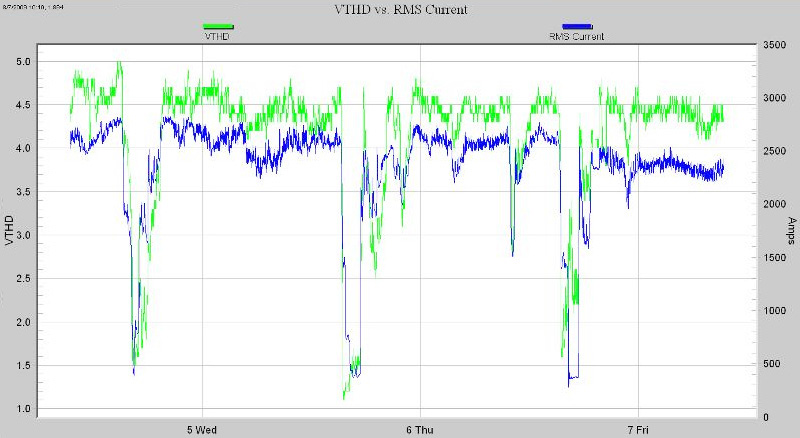
For a PFC study, there are two issues involved with harmonics. The PFC could resonate with existing inductive loads. If that resonance happens to be at a frequency with existing high harmonic levels, the resonance can increase harmonic problems at that specific harmonic number. A harmonic survey before introducing the PFC can reveal harmonics that may fall within the typical PFC resonance values. Total harmonic distortion trend data (as shown in Figure 6) shows if harmonic levels are high; if they are, individual harmonics may be logged to determine which are a problem.
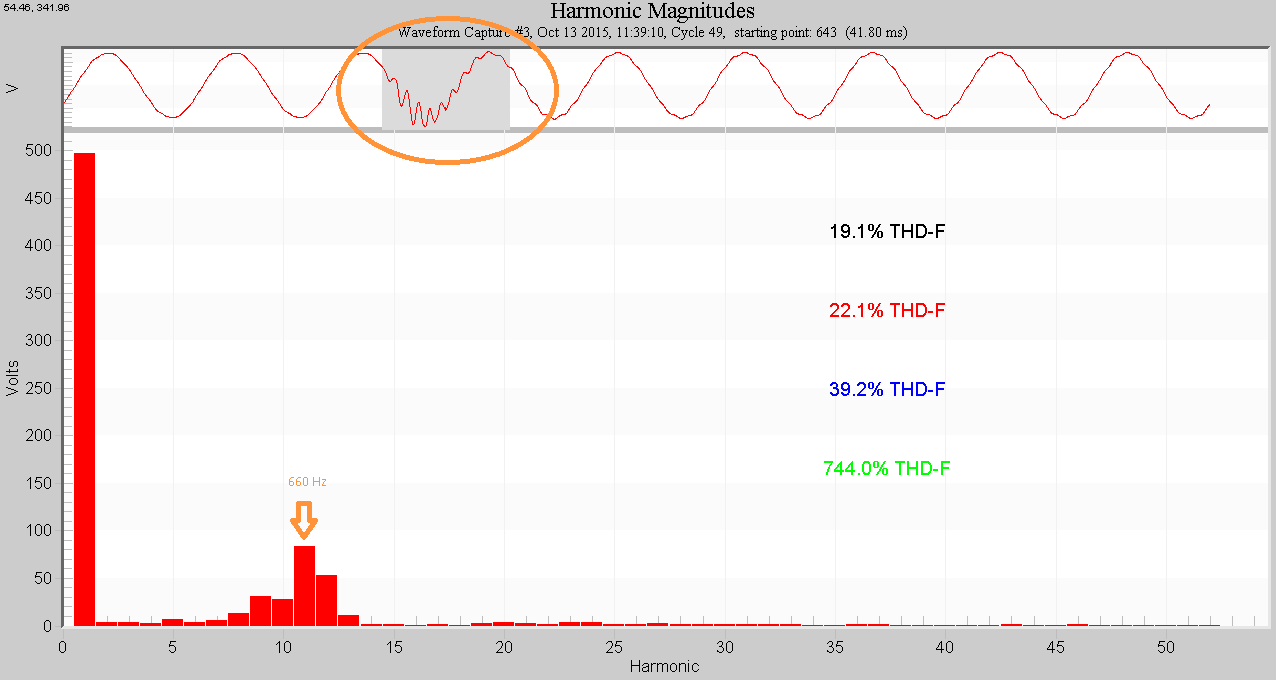
The second issue is resonance excitation due to switching events, including the PFC itself. Here the circuit is quiet near the resonance frequency in steady-state condition, but an impulse or step change in voltage or current due to equipment switching or other transient events may cause a sharp resonance to ring, producing a transient overvoltage condition. This type of problem is difficult to predict in advance. Waveshape triggering with a Revolution or Guardian recorder can catch this event, and a tuned filter may be used for mitigation. Figure 7 shows a typical ringing event caused by a PFC, with a resonance frequency of 660Hz. As a PFC capacitor bank switches into the power network, the impulse (circled in orange) excites a resonance between the capacitor and the inductive load. While not a true harmonic, the harmonic bar chart is still useful for dissecting the disturbance. The oscillatory transients are composed of sinusoidal waveforms, and thus a Fourier transform is directly applicable to their evaluation.
Conclusion
A firm grasp on the behavior of PFC capacitors along with their effect on PF and harmonics is necessary before making any alteration to a power network. Before adding a PFC, a harmonic survey is useful to determine existing levels, and help predict if filtering will be necessary. After installation, monitoring near the PFC for harmonic level and switching transients should be performed to determine if a sharp resonance is present, and what effect it has on the circuit. Waveshape triggering and harmonic trend data are essential for analysis in ProVision to verify that a PFC is not creating more problems than it solves.
