Abstract
Harmonics are usually recorded as interval (stripchart) data in PMI recorders. Each desired harmonic is recorded as a min/ave/max stripchart trace, for each desired voltage and current channel. Although this gives a complete picture of harmonic levels versus time, it can be memory intensive, and present much more data than may be needed. An alternative is to enable periodic waveform capture, and analyze the harmonics from the captured waveforms. The advantages of this method, and recommended settings and methods for using periodic waveform capture for harmonic analysis are presented here.
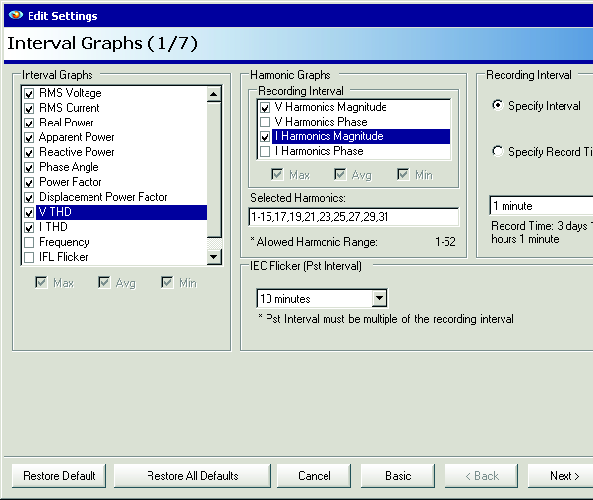
The traditional method for recording harmonics in a PMI recorder is through stripcharts. Each individual harmonic (e.g. 1st, 2nd, 3rd, etc.) for each channel of voltage and current, and for magnitude and phase, may be enabled. On a four-channel recorder such as the Eagle 440 or Revolution, this could be up to 51×2×2 = 204 stripcharts (51 harmonics, voltage and current, magnitude and phase) for each channel. A more typical setup (shown in Figure 1) only includes harmonic magnitudes for harmonics through the 15th, and odd through the 31st, and yet is still 46 harmonic stripcharts vs. 10 non-harmonic stripcharts.
All enabled stripcharts use the same recording interval (1 minute in the example shown in Figure 1). In the example shown, the recording time is reduced to less than 4 days, due to the number of harmonics recorded, and the 1-minute interval.
In a serious harmonic investigation or instances where the problem harmonic numbers are already known, stripchart harmonic recording gives the most detailed information and is the recommended method. The extended memory of the Revolution (up to 1GB) allows for longer harmonic studies with all harmonics enabled and gives the most complete picture possible. But, much harmonic information is available without using any harmonic stripcharts at all.
Periodic Waveform Capture
Most PMI recorders with waveform capture can be set to periodically trigger a waveform capture. These captured waveforms can be analyzed by ProVision to give a full harmonic analysis for that capture. By analyzing each periodic waveform, harmonic snapshots throughout the recording session can give a good indication of steady-state harmonic levels. Since harmonics are a steady-state phenomenon, it’s much more meaningful to analyze “normal” waveforms from a periodic capture, rather than atypical waveforms from a PQ event.
To enable periodic waveform capture, select a time period under Period Capture. Figure 2 shows the Waveform Capture setup screen, with the period being set to 30 minutes. This period can range from 1 minute to 4 weeks, but the period should be so the waveform capture memory lasts roughly as long as the recording session. The number of waveforms, and time until memory is full, is shown in the Info section of the waveform setup screen. In this example, 318 waveforms may be captured, giving almost a week of recording time with 30-minute periodic captures.
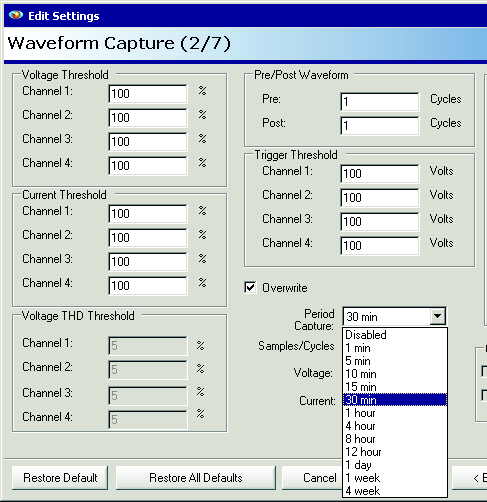
The number of Pre and Post waveform cycles may be adjusted to increase the recording time. In Figure 2, the settings are adjusted specifically for periodic waveform capture. The Pre and Post number of cycles is set to the minimum, 1 each (resulting in a 3 cycle waveform capture). The other trigger parameters are set to 100, which effectively disables any triggering from voltage sags, etc. This will prevent actual PQ events from triggering waveform captures, so these settings should only be set like this when waveform capture is ONLY being used for periodic capture. If PQ events must also be captured, then the resulting waveforms will be a mix of periodic and non-periodic waveforms, and the total recording time may be reduced – the Info box in the settings window only shows the effects of periodic capture.
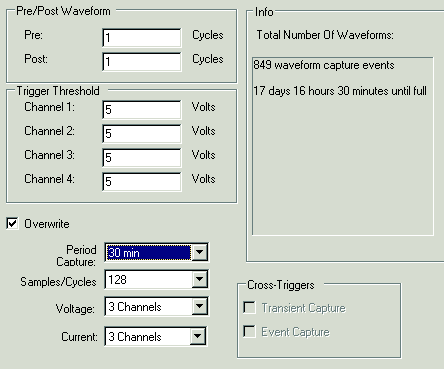
The sampling rate and number of channels may also be optimized to increase the waveform capture recording time. In a harmonic analysis, the 4th channel may not be needed, at least for voltage. The number of voltage and current channels may be set independently in the waveform capture setting screen; these should be set to just the number of channels desired. The sampling rate, defaulting to 256 samples per cycle in most PMI recorders, may also be lowered. For analyzing to the 51st harmonic, it’s possible to lower the sampling rate to 128 samples per cycle, without a loss of resolution. Since the recording time is directly proportional to the number of channels, and sampling rate, setting these correctly can greatly extend the recording time. In Figure 3, using 3 channels and 128 samples/cycle more than doubles the recording time to over 2 weeks. A full month could be covered with a 1 hour capture period.
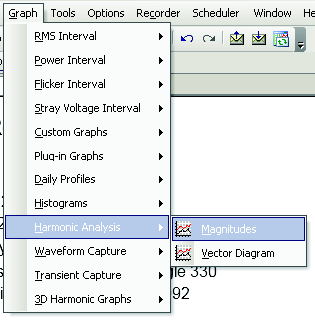
After the recording is downloaded, the waveforms may be analyzed in ProVision for harmonic content. From within ProVision, choose Graph, Harmonic Analysis, Magnitudes to begin (Figure 4). This will launch a window with a list of all captured waveforms. Select one to start the analysis. The captured data will be shown as a time series plot in the top of the graph, and as three harmonic bar charts in the lower three graphs (voltage, current, and power). Figure 5 shows a typical capture. The harmonic levels are computed by ProVision (along with the THD) and plotted.
The harmonics are computed from a single cycle’s worth of data in the capture. This cycle is highlighted in gray in the top time series plot. To change the analyzed section, “grab” the gray rectangle by clicking and holding the left mouse button down on it, and drag the rectangle left or right to cover the desired cycle. The harmonic analysis will change when the mouse button is released.
If the data is from a periodic waveform capture, then each cycle will likely be largely identical, and it doesn’t matter which one is selected for the analysis. If the waveform was triggered from a PQ event, then the analyzed area should be moved to a “normal” section of the capture, usually near the beginning or end. One exception to this rule of thumb is when finding the resonant frequency of an oscillatory event (e.g. ringing from a capacitor bank switch); however, for steady-state harmonic trends, PQ events should be avoided. These voltage and current channel settings, and samples per cycle setting only affect the waveform capture storage. All other functions are performed with the full 256 samples per cycle, and other record types always record all channels (or use the stripchart channel setup).
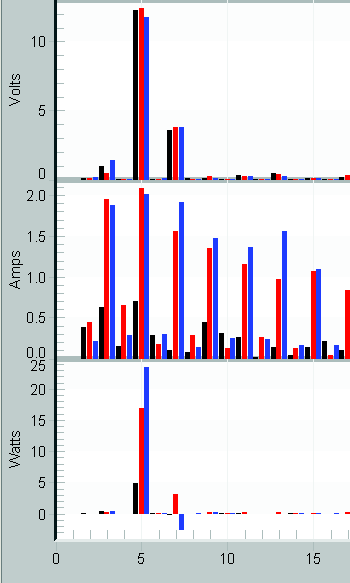
The fundamental is often much larger than the other harmonics, and the graph autoscaling to it may obscure the others. Clicking the graph and typing the F hotkey, or right-clicking and choosing Show Fundamental will toggle the 1st harmonic off and on. The graph rescales after this change. The screen capture in the right of Figure 5 shows the same harmonic analysis with the fundamental turned off. The magnitude of the 5th harmonic for voltage is much more apparent, and the 3rd and 7th harmonics are now easily visible.
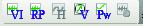
When the harmonic graph has focus (done by clicking anywhere in the graph), the Page Up/Down keys may be used to go through the different waveform captures. This provides a very quick method to cycle through all the captures and view harmonic levels throughout the recording. The waveform capture toolbar (Figure 6) can be used to quickly switch between Waveform and Harmonic views of the capture (labeled VI and H in the toolbar, respectively).
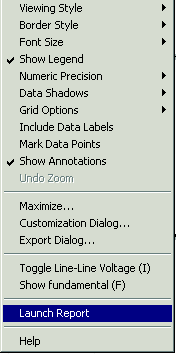
If more detailed harmonic analysis is required, the data set may be exported to Excel. Right click on the graph, and choose Launch Report (Figure 7).
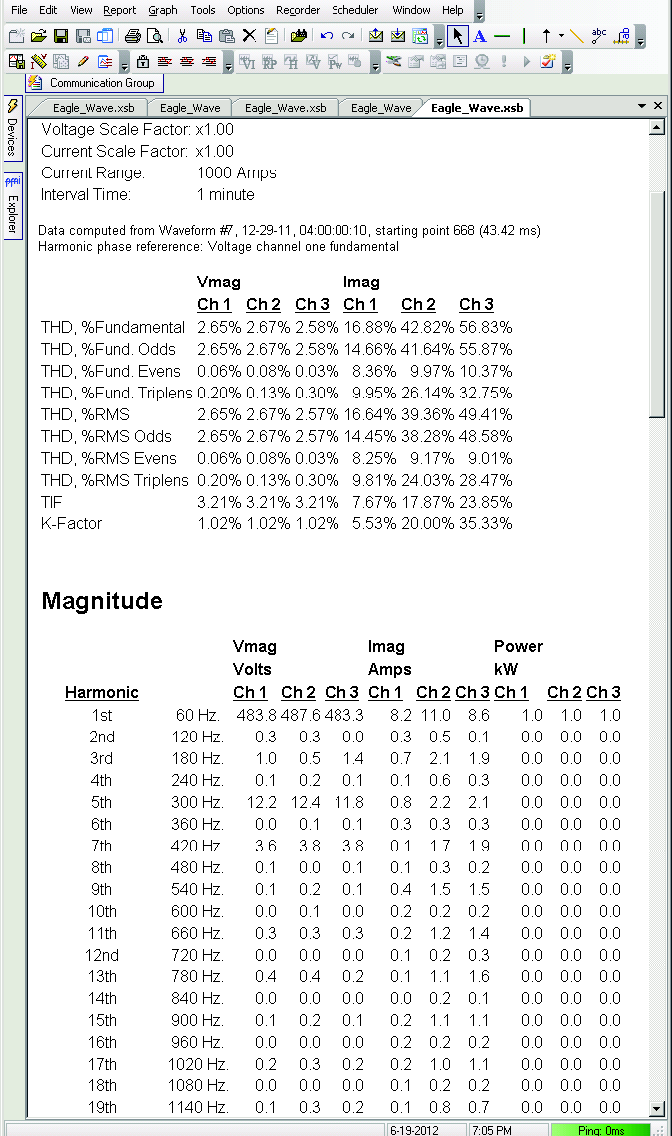
As shown in Figure 8, the Harmonic Report contains a breakdown of harmonics by triplens and even/odd. Also given is each magnitude and phase for the first 51 harmonics, for voltage, current, and power. The report may be exported to Excel for a more detailed analysis by right-clicking on the report and choosing “Export to Excel”. With waveform-based harmonic analysis, all 51 harmonics are available, even the phase angles (using the report). This level of detail with stripcharts would require a very large amount of memory, or a much-reduced recording time. A primary advantage of using waveform capture for harmonic analysis is that very little extra memory is used. The disadvantage is that the time resolution is much poorer than with a typical stripchart interval (e.g. 1 minute). If a wide range of harmonics is required, but fine time resolution isn’t, then waveform capture can be a better way to capture harmonics in a recording than the stripcharts.
A key point with harmonic analysis with waveform capture is that it’s always available if a waveform has triggered. Even if all the captured waveforms were triggered by PQ events, generally there’s at least one “normal” cycle in a triggered waveform suitable for a harmonic analysis. By performing a harmonic analysis on the “normal” steady-state cycles, steady-state harmonic snapshots can be seen for “free,” without consuming any extra recorder memory.
Periodic waveform capture is also important for PQView users performing harmonic studies. PQView includes mechanisms for automatic harmonic computation from waveform capture data. Because only steady-state harmonics are desired with this PQView function, ProVision has been designed to mark each waveform capture as triggered by a periodic capture or PQ event when exported to PQDIF format. This flag allows PQView to correctly analyze only periodic “steady state” waveforms, instead of triggered waveforms.
Conclusion
Periodic waveform capture is a useful tool for capturing steady-state harmonic data without consuming large amounts of stripchart memory, when fine time resolution isn’t required. Harmonic levels can often be assessed with waveform capture data even when periodic capture wasn’t configured, with careful selection of the analyzed cycles.
