Abstract
The explosive growth of modern electronic loads presents a challenge to utilities in the form of waveform distortion. The IEEE 519 standard is an important tool for utilities, providing limits for utility customers on current distortion and for utilities themselves in regards to voltage distortion. Applying the standard can be a complex process, but the addition of IEEE 519 compliance tools in PQ Canvass allows for automatic report generation in a web browser on demand.
Introduction
IEEE 519:2022 is titled Standard for Harmonic Control in Electric Power Systems. The standard establishes voltage and current harmonic limits for both suppliers of electricity and end users. The philosophy behind the standard is that both sides of the revenue meter have some responsibility in limiting waveform distortion. End-users of power must limit current distortion, and providers of power must do their part by keeping the system impedance low enough to limit voltage distortion. These limits are on specific harmonics, and overall distortion.
The 519 report in PQ Canvass report compares the harmonics recorded at the point of common coupling (PCC) with the limits established in the IEEE 519 Standard and determines compliance status for utilities and their customers. PQ Canvass makes this easy for users by enabling any of our recordings to be processed on-demand according to the IEEE 519 standard. Daily 99th-percentile, Weekly 99th-percentile, Weekly 95th-percentile, and Summary reports can be generated in just a few clicks.
Recording the Right Data
To be able to generate an IEEE 519 Report, a recorder must be set up to gather the required data. A formal 519 analysis requires harmonics recorded from the 1st to the 50th, for both voltage and current magnitudes. These technically should be “harmonic subgroups”, measured per the IEEE 519 method of aggregating 12 cycle measurements.
The harmonic subgroups are 15 Hz wide bins centered around each multiple of 60 Hz, through 3000 Hz (the 50th harmonic).
The standard calls for both 3 second and 10 minute harmonic measurements. The 3 second readings are tested each day, and the 10 minute readings tested each week. Because PQ Canvass can compute the 10 minute harmonic values from 3 second measurements, only a single recording for a one week period is needed, using a 3 second interval.
Generating an IEEE 519 Report
First, direct your web browser to the PQ Canvass login page and log in using your credentials.
After selecting a recording, click or tap the “Recording” button under the “Report” section.
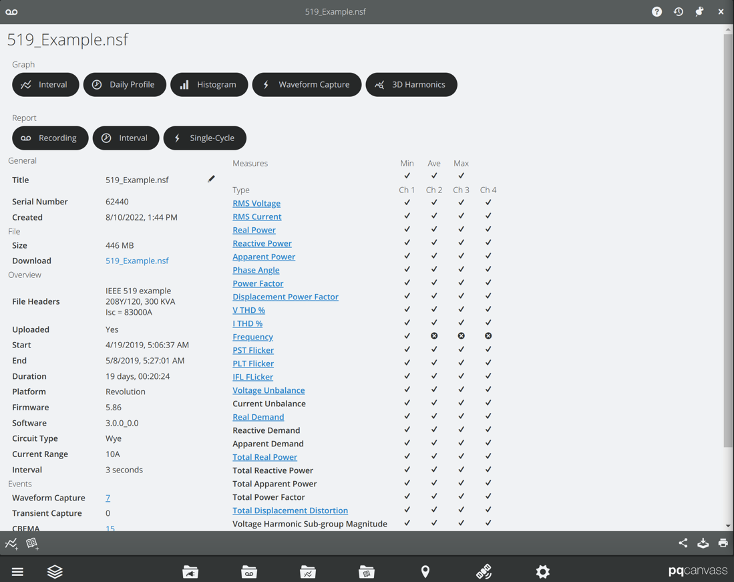
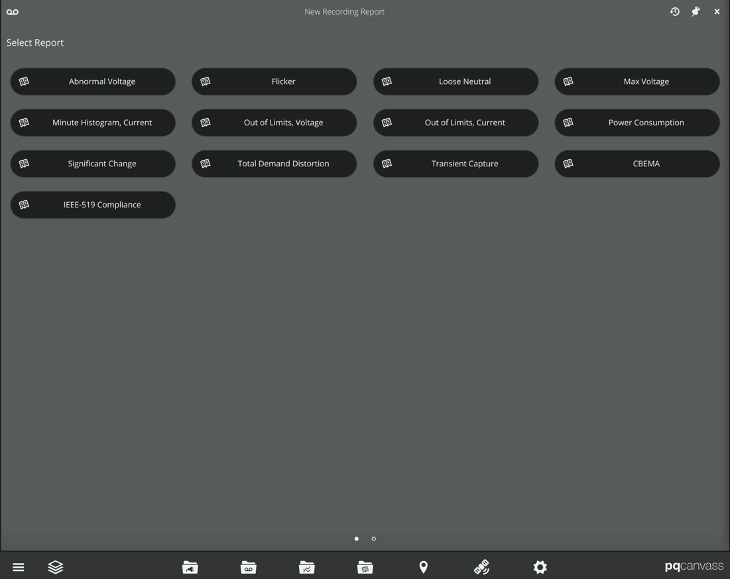
Select the “IEEE-519 Compliance” report button.
Users must select or enter parameters for generating the report, and then click the “Run Report” button.
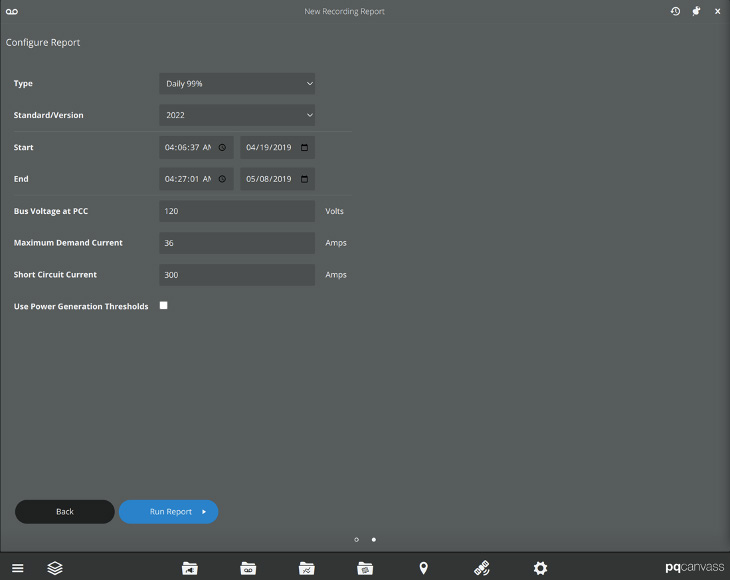
Report Parameters
Report Type
- Daily 99th Percentile report
- Weekly 99th Percentile report
- Weekly 95th Percentile report
- Summary report of all three other reports
Standard Version – Users can choose between the 2014 or 2022 IEEE 519 standard.
Start Time – By default this is the beginning of the recording.
End Time – By default this is the end of the recording.
Use Power Generation Thresholds – Select this option if measuring customer power generation.
Bus Voltage at the Point of Common Coupling (PCC)
Maximum Demand Current
Short Circuit Current
The 519 standard requires four inputs from the user in addition to the raw harmonic measurements. The bus voltage is needed to select the correction voltage and current thresholds. Enter the bus voltage at the point of common coupling, which may not be the actual measurement point. The point of common coupling is defined as the closest point electrically upstream from the customer, where another customer could be connected to the system. For example, in many 3 phase situations, the point of common coupling is on the primary side, but the recording is more often on the secondary of the transformer. In this case, enter the primary side voltage. Also, enter the real primary voltage even if the voltages are recorded through 120V PTs.
The “max demand load current” is used to scale current harmonics, and to compute Total Demand Distortion. This is defined as the “sum of the currents at PCC, corresponding to the max 15 or 30 minute demand during each of the 12 previous months, divided by 12”. This is the max thermal demand each month at the location, averaged over 12 months. The short circuit current is needed at the point of common coupling. Finally, if the customer has local generation, then check the “use power generation thresholds” option, which alters the current thresholds.
Viewing the Report
The IEEE 519 Compliance Report is broken up into the following sections:
Report Header
This section displays general information from the recording header, parameters used to generate the report, measures used in the report, and any user-defined scale factors.
Report Summary
Any errors or warnings encountered during report generation are shown at the top of this section. These might include unrecorded data types, harmonics or non-standard recording intervals. Note that even if a non-standard interval is used the report will continue, but advises the users that actual standards compliance cannot be verified due to the non-standard recording interval. However the report still gives useful information even if all 50 harmonics were not recorded, or if the interval was not technically 519 compliant.
Next, a table of voltage compliance status for each reporting period (day/week) and each channel, and another table for current compliance status are displayed. The voltage and current multipliers are shown at the top of each of these tables. If not enough data can be found for a reporting period, the percentage of data that was found is displayed to the right of the table for that row. If a Summary Report was selected, there will be three summary sections; one for each of the other report types.
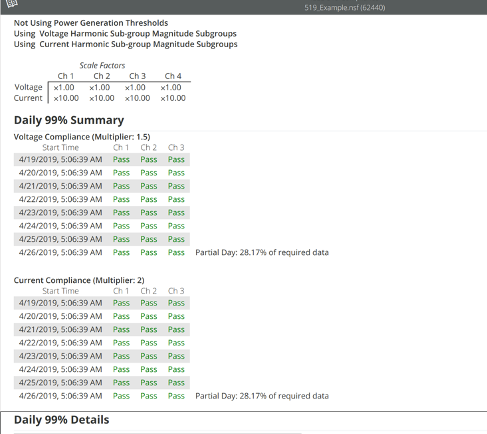
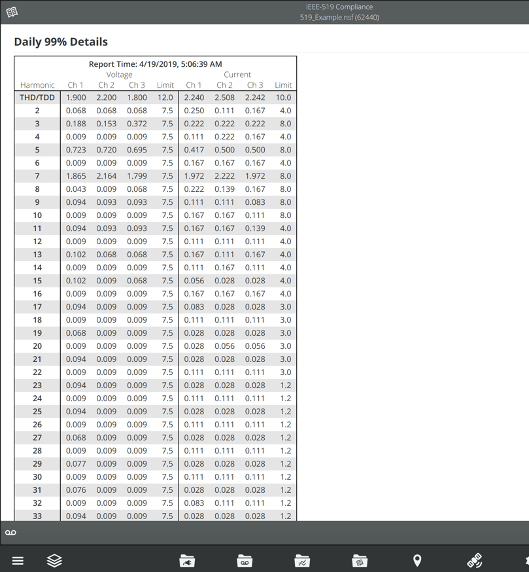
Report Details
A “details” section is generated for each reporting period found inside the requested start and end time for the report. These will show the values that were computed to determine the pass/fail status for the reporting period. Voltage THD and harmonic distortion percentage for the voltage measure used are shown on the left side of the graph. The right side shows the Total Demand Distortion and harmonic distortion percentage for the current measure used. Up to three channels for voltage and current are displayed in this manner, along with their computed distortion limits, according to the selected IEEE 519 standard. Please note that the “Report Details” sections will not appear on the Summary Report.
It can be helpful to re-run the report a few times with different short circuit current and max demand load current values. The results are sometimes sensitive to those values, and a small variation may turn a pass into a fail, or vice versa. The max demand load current may have some uncertainty or variation, so it’s helpful to know if the results are different with a small difference in the estimate.
Conclusion
PQ Canvass makes it effortless for users to change reporting periods, report types, standards, and other parameters for generating IEEE 519 Compliance Reports. A simple but clear layout immediately gives the user the compliance status they need, while also providing the granular details in a coherent format. The report is also useful without all the data required for a formal 519 analysis, providing harmonic levels compared to the standard for the data that is present in the recording.
