Abstract
This white paper reviews Flicker theory and details the Flicker Standards that are used by PMI recorders. Most PMI recorders have the ability to measure Flicker. Many models and options have the ability to measure to IEEE 141 (GE Flicker Curve), IEEE 1453 / IEC 61000-4-15 (IFL, Pst, Plt Flicker). Flicker can be a very irritating power quality issue and can also be very hard to resolve. In order to fully understand the differences between the flicker standards, it’s a good idea to review general flicker theory.
Flicker
Flicker can be defined as a visible fluctuation in light intensity due to voltage variations. Flicker is generally more common in incandescent light than in fluorescent light. The human sensitivity to light intensity changes with magnitude of modulation and frequency of occurrence. RMS voltage changes of only 0.25% can produce visible changes in light output.
Flicker Causes
Flicker is caused by voltage changes produced by load currents through system impedance as shown in Figure 1 and Figure 2. The effect of large loads produces voltage modulation on the line creating noticeable changes in light intensity. Loose connections can also contribute to large amounts of Flicker due to the elevated impedances on the system.
Flicker Standards
There are 3 major standards that have been adopted over the years to help solve major issues associated with flicker. Below is a brief explanation of the different standards.
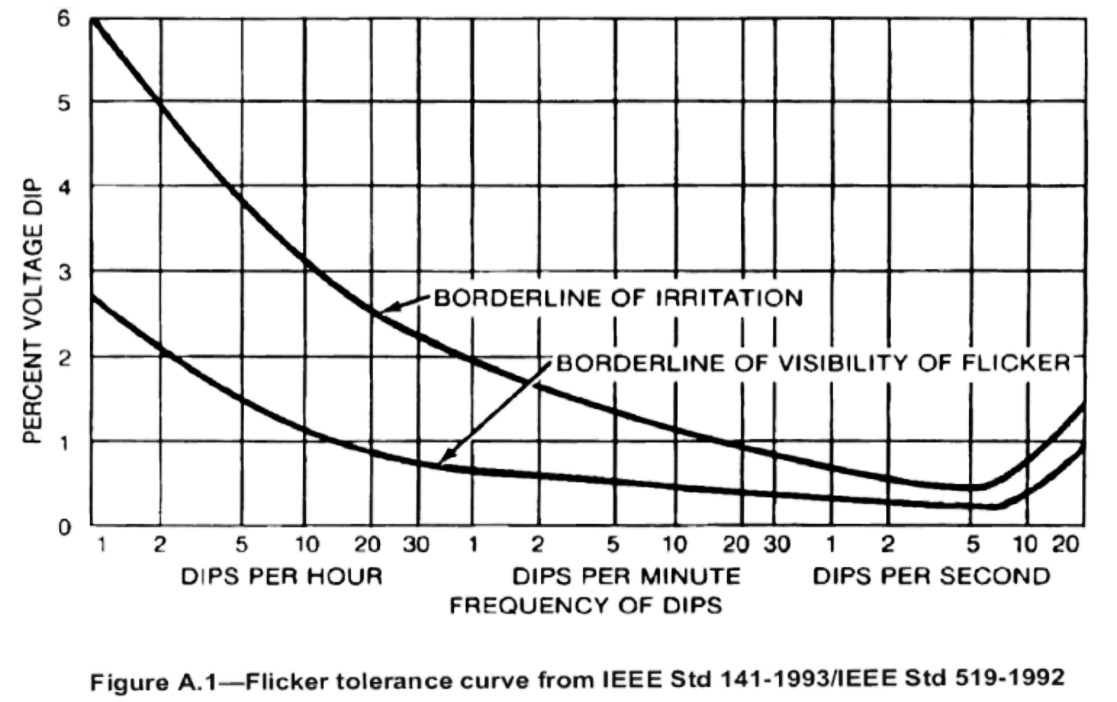
IEEE 141. Also known as the GE Flicker Curve, IEEE 141 was developed by GE and several utilities to figure out the human response to light variations. Frequency of occurrence during the tests was based on number of voltage dips, not the number of changes.
The IEEE 141 method represented voltage variations produced by a single source. Figure 3 shows the GE Flicker Curve borderline of irritation.
IEEE 1453: Recommended Practice for Measurement and Limits of Voltage Fluctuations and Associated Light Flicker on AC Power Systems.
IEC 61000-4-15: Testing and Measurement Techniques, Flickermeter Functional and Design Specifications.
IEC 61000-4-15 was adopted and incorporated into the IEEE 1453 standard. The combined standards recognize the need for a new method of flicker measurement. The standards outline the few facts that the old standard IEEE 141 didn’t account for. The standards realize that real loads produce modulation and voltage magnitude that is more complex than what was originally used in the GE flicker curve tests. In AC power systems most situations are combinations of several flicker sources. The combination of sources can come from random loads, varying patterns of operation, and multiple levels at various frequencies.
Instruments based on IEC 61000-4-15 more accurately account for complex voltage fluctuations encountered in actual practice. The Flickermeter described in IEC 61000-4-15 standardizes flicker monitoring across different manufacturers; IEC “flickermeter” compliant instruments should all produce same results for a given flicker excitation.
These standards combined to create a model defining a special amplitude modulation analyzer based on the human light-eye-brain response. This model, shown in Figure 4, was used to emulate the nonlinear eye-brain response and perceptual memory effects in the human brain. The output of the model is the instantaneous flicker sensation IFL.
Flickermeter Breakdown
Block 1: Input Signal Scaling
Adjusts input voltage to a normalized reference level. Flicker measurements are independent of actual input voltage magnitude (measurements are expressed as a percent change in voltage, not the level of voltage).
Block 2: Demodulator
Recovers the voltage fluctuation and rejects the 60Hz content. This block simulates the behavior of a lamp with varying output intensity.
Block 3: Lamp-Eye Response System
Created from three filter blocks:
- Filter 1: High pass, eliminates DC content
- Filter 2: Low pass, frequency cutoff = 42Hz; Eliminates ripple component of block 2
- Filter 3: Weighting response of a filament lamp combined with the human visual system (peaks at 8.8Hz)
Block 4: Eye-Brain Response
Used for implementing the remainder of the lamp-eye-brain response model. Block 4 simulates nonlinear eye-brain response and perceptual storage effects in the human brain. Output of block 4 is the instantaneous flicker sensation (IFL).

Block 5: Statistical Analysis
Statistical analysis of the IFL flicker is used to create Pst and Plt flicker values. Pst values are computed by an analysis of the IFL values over a 10-minute period. Plt is a root mean average of the Pst values over a 12-period sliding time span.
Pst: Flicker Perception, Short Term
Plt: Flicker Perception, Long Term
Flicker Measurements
The measurement of flicker in PMI products is based on the previously defined standards for practical measure. Below is a brief explanation of the different measurements and terminology.
GE Flicker
The GE flicker measurement is based on the IEEE 141 – GE Flicker Curve data. As previously discussed the GE flicker curve is an analytical model of the human response to light variations. The GE Flicker measurement in PMI recorders is based on 3 parameters:
- Period – The measurement time interval
- Tolerance – Percent voltage change
- Limit – Number of occurrences allowed during the time period
All measurements are based on the threshold of irritation from the GE Flicker curve as shown in Figure 3.
Pst Flicker
Pst or Percentile Short Term flicker is based on the IEEE 1453, IEC 61000-4-15 standards. Pst is the measure of how much a fluctuating AC voltage causes noticeable incandescent light flickering. Short term flicker severity is a statistical measure of IFL – time at level analysis. This measurement, normally updated every 10 minutes, takes into account the differing sensitivity to different voltage modulation frequencies and repetition patterns. It is designed so that a Pst of 1.00 is noticeable to 50% of the population, and is considered a threshold of acceptability. Pst is computed by a statistical analysis of the IFL readings during a 10 minute period. Pst values are normally graphed as a stripchart over time.
Plt Flicker
Plt or Percentile Long Term flicker is based on the IEEE 1453, IEC 61000-4-15 standards. Plt is the measure of long term flicker used for determining the combined effect of several randomly operating loads. Plt is a root mean average of the Pst values over a 12 period sliding time span (e.g. 2 hour window if the Pst period is 10 minutes). Like Pst, a Plt value over 1.00 is generally considered a potential problem. Plt can be computed by software after a recording, using only the Pst data.
IFL Flicker
IFL or Instantaneous Flicker Level is based on the IEEE 1453, IEC 61000-4-15 standards. IFL quantifies voltage fluctuation at a given instant. Voltage sags will immediately cause a change in the IFL data. IFL calculations include the eye-brain sensitivity curve for different modulating frequencies, but not the statistical aspect of how often such fluctuations occur. A high IFL reading may not result in a high Pst value if it’s not a frequent occurrence. Thus, IFL readings aren’t always useful for determining if flicker is too high. IFL readings are used for tracking down what load is causing a flicker problem. If a load starts or stops at the same time the IFL reading changes, that load may be contributing to a high Pst reading.
Conclusion
Flicker is a very interesting and complex aspect of power quality. The standards defining flicker set a baseline for all flicker calculations. With a little background knowledge in the standards associated with flicker, your recorded data maybe easier to analyze. The time spent reviewing the different flicker measurements will help to pinpoint the problem and is well worth the effort.
