Abstract
Power quality analysis is a rapidly changing field, and is intrinsically linked to advances in digital technology. From its humble beginnings as analogue recorders that wrote a single voltage directly to a disk of paper, to devices that can measure hundreds of interharmonics and store a gigabyte of data, power quality analysis has benefited from the never ending march of technology. This paper will explore the history of PQ analysis equipment, from analogue recorders to recent devices, like those developed by Power Monitors Inc.
Early PQ Recording
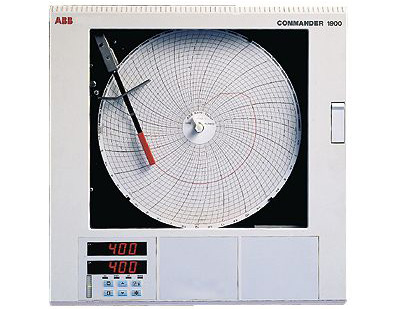
Power quality monitoring really began in the military and industry sectors, as consumer residents were not creating high or complex loads to become a problem. The first PQ analyzers were analog and wrote to paper strips. This is where the term “stripchart” comes from. Values are written onto the paper via a head, like an EKG machine. Analog recorders also came in versions that wrote to circular paper (Figure 1). These machines were more compact, but they had smaller recording times. The parameter being measured (e.g. RMS voltage, current) directly moved the recording pen, and the paper speed could be adjusted as a crude method for adjusting the time resolution.
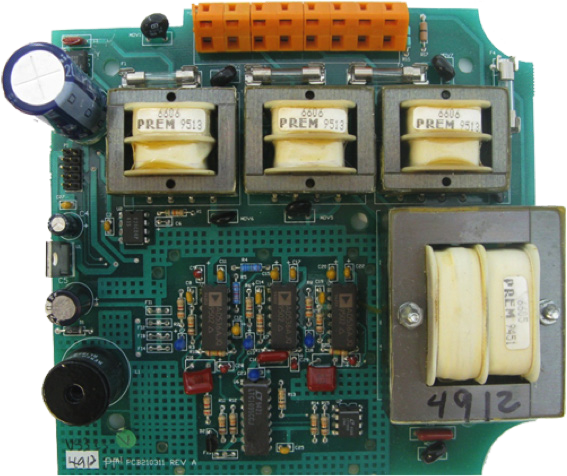
The 1980’s introduced a new factor that created a need for more advanced power quality tools: the personal computer. The PC draws a non-linear load, introducing harmonic distortions into the power system. Previously many loads were mostly linear, like light bulbs and motors. These new nonlinear loads introduced problems for the grid, such as transformers overheating and neutrals catching fire. Since triplen harmonics don’t cancel out in a three phase neutral wire, but rather add, buildings wired with undersized neutrals were at risk for overheating or fire. Early PCs not only contributed to PQ problems, but were much more sensitive to voltage sags and other disturbances than traditional electromechanical loads. As with all harmonic distortion introduced into an electrical system, the customers farther down the line receive the worst quality voltage. The 1980’s also saw the introduction of digital power quality recorders. These first recorders were very large and had little internal memory (Figure 2). True-RMS electronic recorders became common, important for the increase in nonlinear loads by this time. Digital recorders brought increased reliability and repeatability to PQ recording, and eliminated the mechanical problems inherent in paper stripchart recorders. Complex event-triggered recording methods helped capture voltage events with adjustable thresholds. Another advance was recorders powered by the line that they were monitoring, eliminating the need for a separate power source.
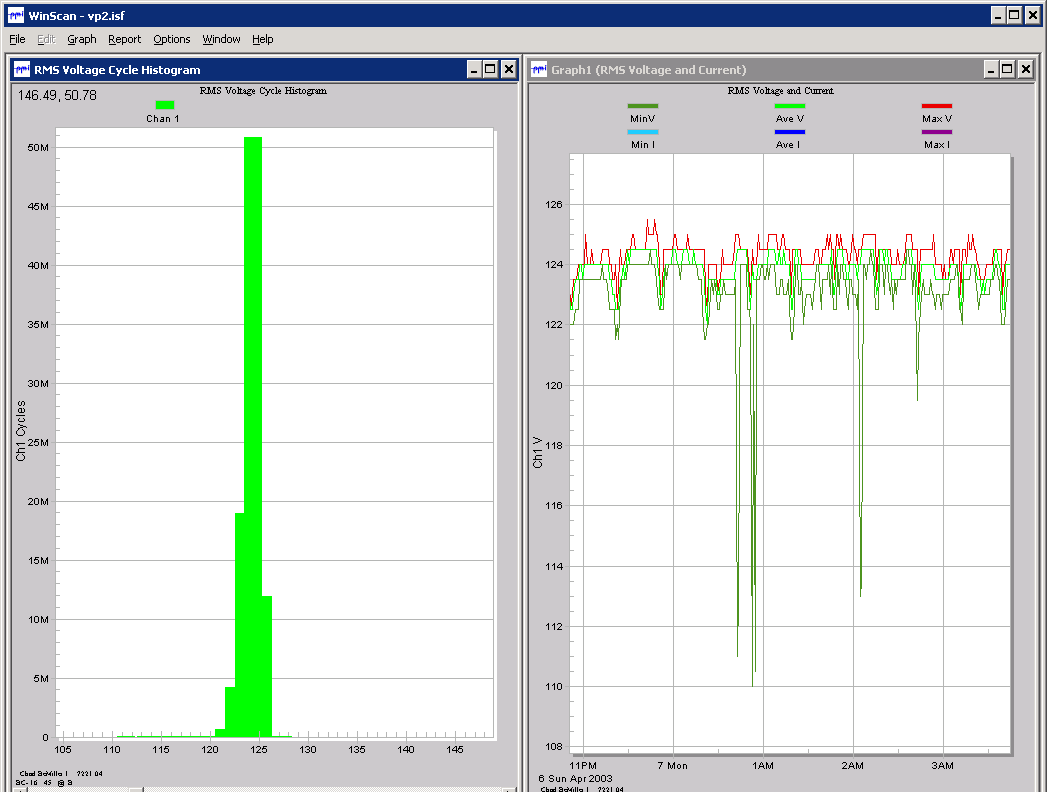
In the 1990’s several advances in power quality recorders were made possible by advances in digital technology. Electrical components continued to get smaller which allowed the recorders themselves to get smaller. Flash memory allowed for longer recording times, and the ability to upgrade device firmware to add new features and patch bugs. Early dial-up modem and even analog cell technology allowed data to be remotely downloaded from recorders. This technology made it much easier and safer to get data from a recorder. A recorder would have to be pulled from an installation site, brought back to an office where it was analyzed, and then brought back and reinstalled. This is a very time consuming task. Recorders are often attached in arc-flash locations, and special precautions must be taken to install and remove recorders in this situation. Unfortunately, download speeds were limited with early modem and cell technology, so recordings sometimes took a long time to download, but the increase in safety and convenience was still significant. Also introduced in the 90’s were Windows-based power quality analysis programs for personal computers. An example of this is PMI’s WinScan software (Figure 3). These computer programs would become essential for analyzing power quality data.
Digital Evolution of PQ Recording
A great advancement in the first decade of the 21st century was the maturing of the wireless networking, both cell and local. More robust connections with higher bandwidth meant that larger recordings could be downloaded faster. Bluetooth technology was introduced to recorders in 2004. Bluetooth technology allows data to be transferred to and from a device from a close distance (under 100 feet, shown in Figure 4).
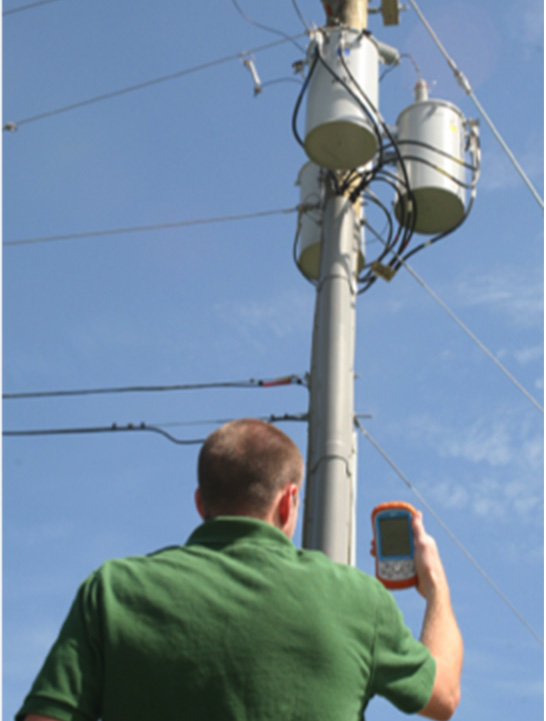
A practical benefit of this is that a lineman can come within distance of an installation and safely download recordings from the device, without exposure to hazardous voltage. Wireless data download, combined with recorders small enough to fit behind a closed panel or transformer door, means that arc flash suits are no longer needed.
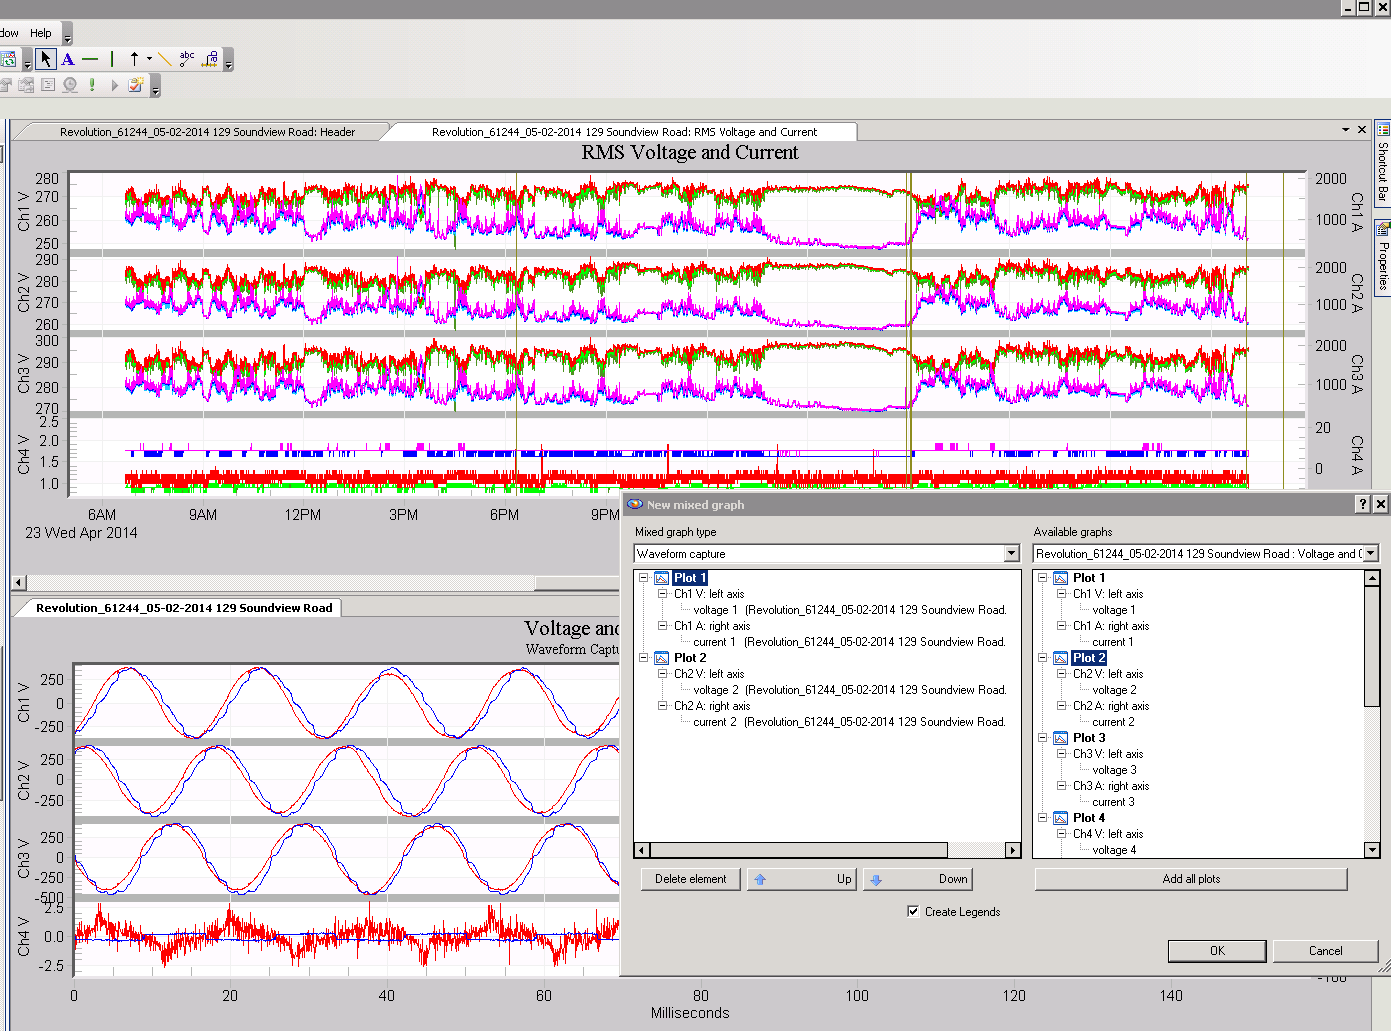
During the 2000’s digital technology continued to become smaller and cheaper. Recorders became available with Flash storage for megabytes and even a gigabyte of recording data, like the PMI Revolution, all of which can be downloaded remotely from the comfort of an office. Slow RS 232 connections were also replaced with USB. High-speed transient capture, formerly only found in the most expensive, largest recorders, became available in pocket-size recorders like the Revolution. These recorders go way beyond paper stripchart recorders, measuring PQ parameters such as IEEE/IEC flicker, hundreds of interharmonics, all power quantities, waveform captures, etc. simultaneously.
To handle the large amount of data available from these modern PQ recorders, more advanced PQ software was developed. An example is ProVision (Figure 5), PMI’s .NET-based software. ProVision lets the user overlay data from multiple recordings, create custom graphs, view 3D harmonic/interharmonic graphs, live graphs and data from remote recorders, and manage large numbers of files.
Modern Advances
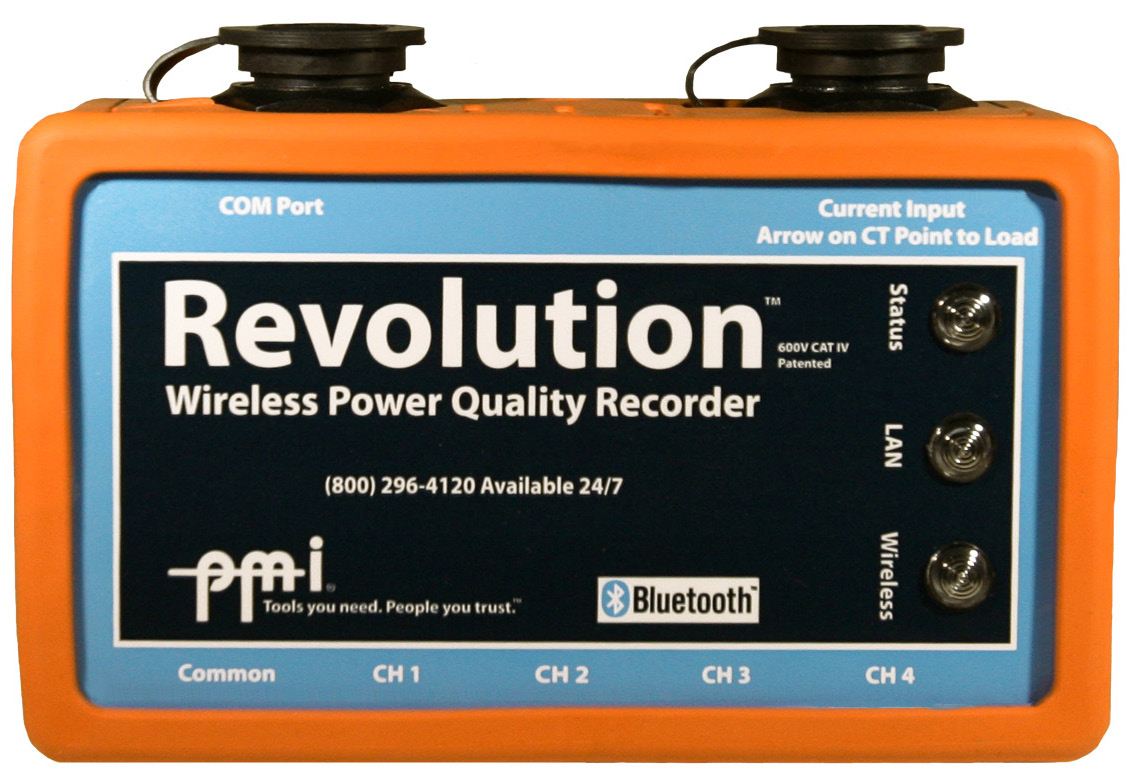
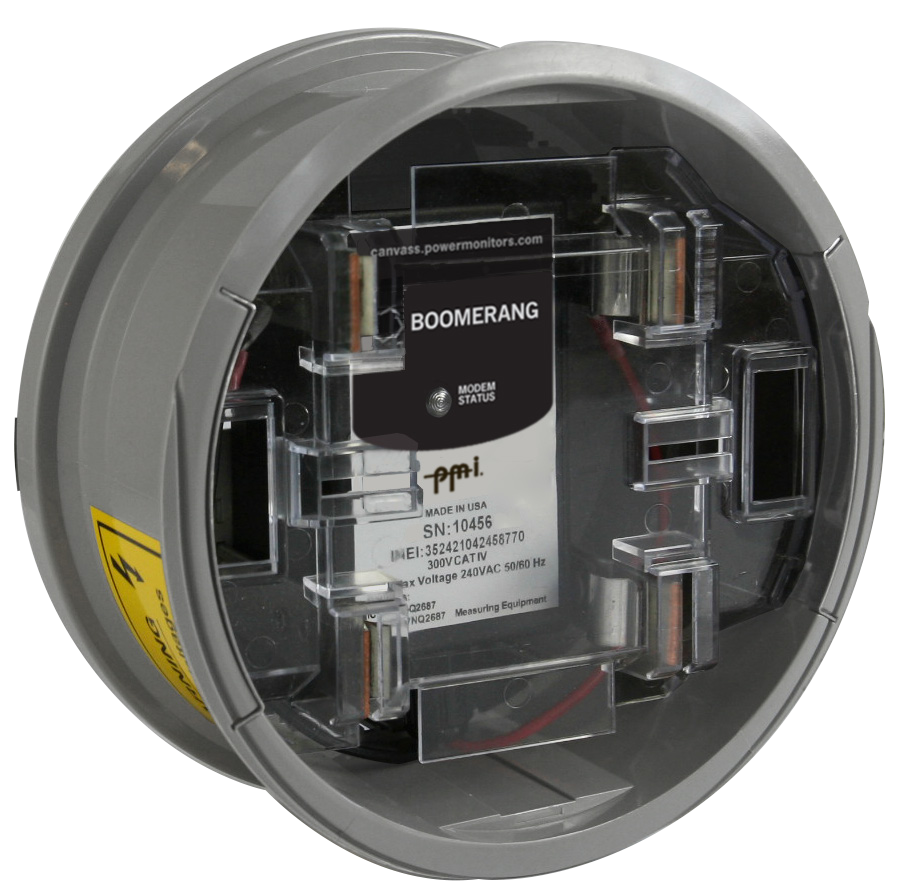
Already in the current decade we have seen huge advances in technology. USB was replaced with higher speed USB 2.0. Embedded digital 2G/3G modem technology has replaced analog modems. In addition, modern digital modems provide a TCP/IP networking model, eliminating the need for a dial-up connection from the user’s PC. Modern devices are often multiple instruments in one – for example, the Boomerang, which is a DNP3-polled SCADA voltage sensor, works in parallel with PMI’s cloud-based Canvass system, acting as a long-term voltage monitor. The Revolution (Figure 6) is also a full PQ recorder through the ProVision software, which also works in parallel with Canvass for steady-state data recording and alert notification.
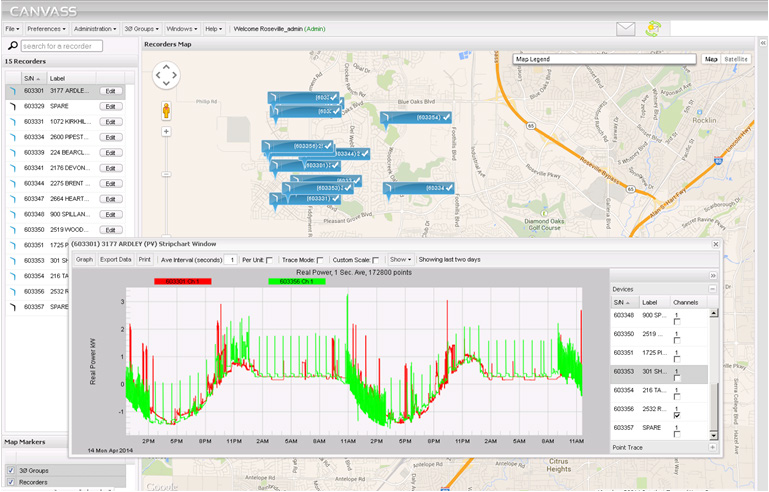
Computing power has also greatly increased, in both individual computers and “cloud computing” – a system in which multiple servers connected via the Internet work together to provide a software platform for the user. Hand-in-hand with cloud computing is “cloud storage,” where data is stored on a server separate from the recording device, allowing the data to be viewed anywhere. PMI Canvass (Figure 7) is such a system. With Canvass, recorders upload their data to a server, and then the data can be viewed anywhere that there is access to the Internet via a web browser. The user simply logs on to the Canvass website and has instant access to graphs of recorded information and can also configure the settings of individual devices. Another feature of Canvass is the ability to set alerts. Alerts can be configured so that an email is sent whenever a recorder enters an alarm state, such as when voltage is low. Cloud-based data storage and analysis removes the IT burden of managing software updates and storing data files from the user, and makes it easy to work with data across different devices and geographic regions (including time zones).
Smart phone technology is also an area of particular interest. Apps are available for smart phones that eliminate the need for recorders with built-in displays. Power Monitors, Inc. has developed a smart phone app for iPhone and iPad that allows users to connect wirelessly to a networked (cell or Ethernet) Revolution recorder and view live waveforms and readings. This makes it very easy to spot check a hookup or problem with an electrical system. The user just needs to walk up to the Revolution, pull out their smart phone, and wirelessly connect to it. Upcoming iPad apps will even allow for data download and connection to Canvass.
All of these advancements are leading to “smart grids”, or systems that are able to adjust voltage levels in real-time based on device feedback. For instance, PMI Boomerang recorders (Figure 8) can be used in such systems. Multiple Boomerangs can be used in tandem to diagnose low or high voltage problems, and the voltage at the source can be adjusted accordingly. PMI Canvass web software can be used in a similar way. Although Canvass does not offer direct control over source voltage, it’s a powerful tool for analyzing a distribution system or profiling/tuning a Conservation Voltage Reduction system. The Boomerangs serve double-duty, presenting a DNP3 interface to a SCADA system, and sending data to Canvass for data storage and analysis.
Conclusion
PQ equipment has a history intrinsically tied to the rise of digital technology. PQ recorders started out as paper fed analog devices that were limited in use to only military and industrial applications. The end of the 20th century saw incredible advances in digital technology, which made recorders smaller and more feature-rich. PMI has been at the leading edge of the technology wave, with a full line of digital PQ recorders, including recorders that can transmit data wirelessly to online storage to be viewed anywhere there is an Internet connection. Future advances will only increase the recording power and communication methods for PQ devices, allowing fewer engineers to troubleshoot and profile an increasingly complex grid.
