Abstract
This white paper is an overview of the Event Capture function available with PMI power quality analyzers. Event capture can be viewed with either ProVision or WinScan software. This paper covers what the Event Capture function is typically used for, what is recorded in the Event Change Table Report, and typical initial settings.
The Event Change Report should be implemented if there is a power disturbance on a cycle basis that needs to be recorded. The Event Change Report gives much more detailed information but is somewhat more complicated to examine than some of PMI’s other reports. The Event Capture function was developed before the Waveform Capture function; it is basically a substitute for the waveform capture in those devices that cannot record raw waveforms. It can also be used in situations where many events might be generated. The event capture function has the advantage of using much less memory than the waveform capture function. The timestamp of a significant change event can be used to find the same disturbance in the Event Change Report for further analysis.
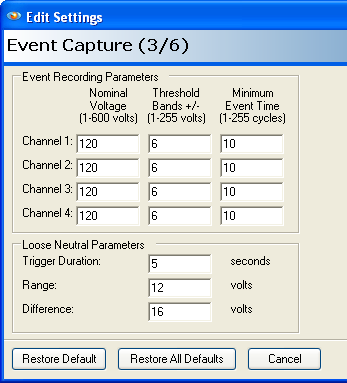
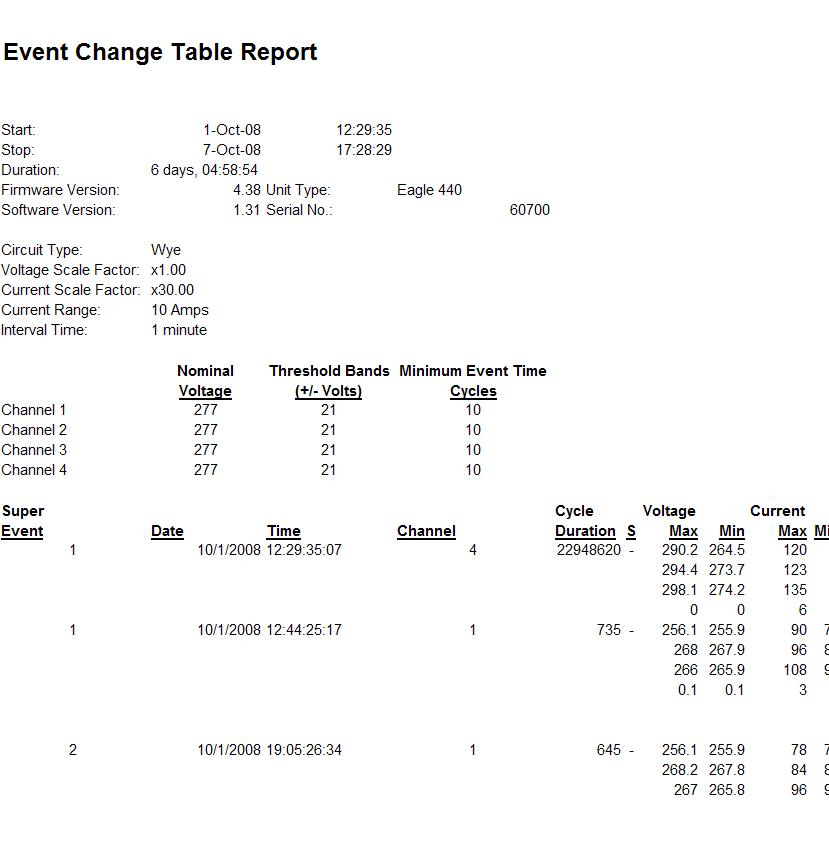
Under Event Capture Settings, Event Recording Parameters (Figure 1), the first column is Nominal Voltage. The default setting under Nominal Voltage is 120 volts. This is a good setting in most cases for a 120 volt system, however in some cases depending where in the system the recorder is installed, this default setting might be a little low or a little high. A good rule of thumb for the initial setup is to adjust this setting to the current line voltage during installation. If the voltage tap is close to a substation, the nominal voltage may be set to 125 volts. The threshold is added and subtracted to the nominal to form the voltage trip point. These trip points can be entered down to zero volts and up to the maximum recorder voltage using multiples of the threshold voltage. For example, if the threshold setting in the second column is set to the default of 6 volts, and the nominal voltage is set to 120, then the first set of trip points would be at 114 volts and 126 volts. The normal voltage band would be between 115 volts and 125 volts. This is where the voltage could wander without triggering the recorder. Since the threshold is set at 6 volts, if the voltage wanders beyond this normal voltage band, a trigger will occur every 6 volts from 120 volts down to zero and from 120 volts up the maximum voltage of the recorder. For example going down the trip points would be on a 6 volt grid, starting at 114, 108, 102, 96, 90, 84, 78… down to 0 volts and a 6 volt grid starting at 126, 132, 138…up to maximum voltage of the recorder. After the recorder has been triggered, this event change will continue until the voltage returns back into the normal band or moves past another trip point. Each time the voltage passes another trip point, the current event is terminated and a new event change is started. This data is compiled in the Event Change Table Report, as shown in Figure 2.
In the Event Change Table Report, whenever an event change is triggered, the trigger time is always recorded with a one cycle resolution. Also the RMS current is recorded one cycle before the trigger along with the direction of the voltage change, or slope. In ProVision or WinScan this is displayed as a minus (-) for a sag or a plus (+) for a swell. During the event, the recorder keeps track of the maximum and minimum current and voltage values. After the event is over, the maximum and minimum RMS voltage and current data is recorded, including the duration, (in cycles). On the next cycle, the RMS current is measured to record the current after the event.
For every channel, all the voltage and current data are recorded regardless which channel triggered the event. If a swell or sag occurs on all three phases at the same time, three events will be triggered simultaneously. Even though these events are recorded separately, each of them may contain the same information.
Examples
Figure 3, below, shows a screen capture of a RMS Voltage Interval Graph. Event captures are marked with circles. Clicking on any of the circles will open the Event Change Report for that circle.
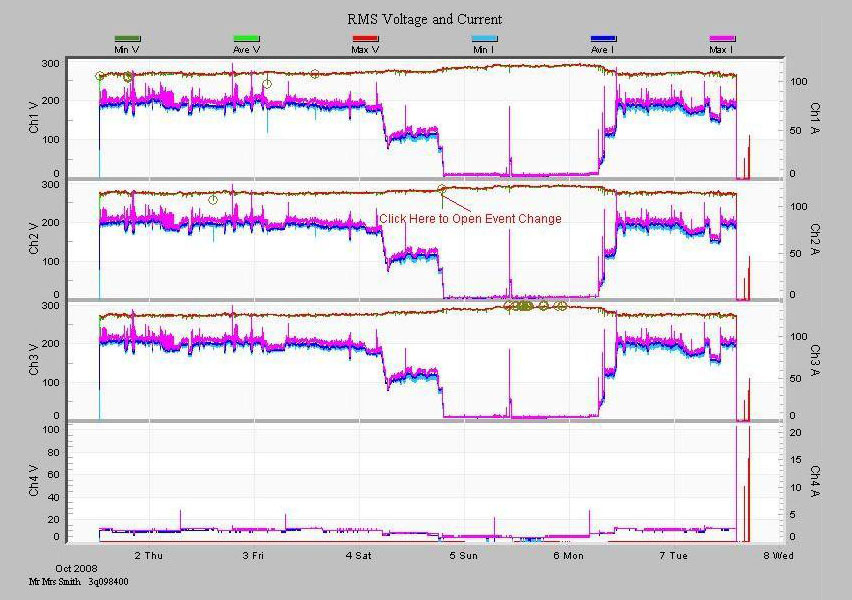
Figure 4, right, shows the Event Change Table Report from clicking on the circle annotated in Figure 3.
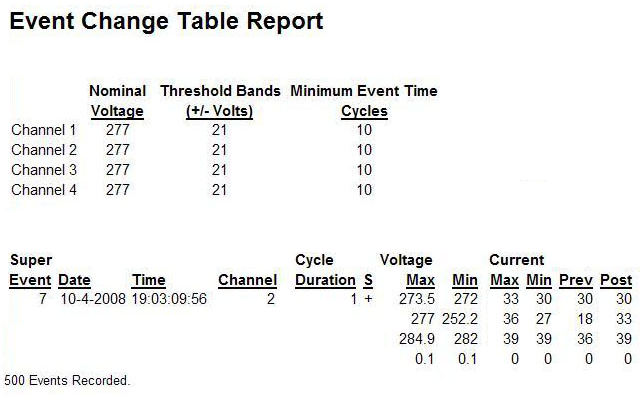
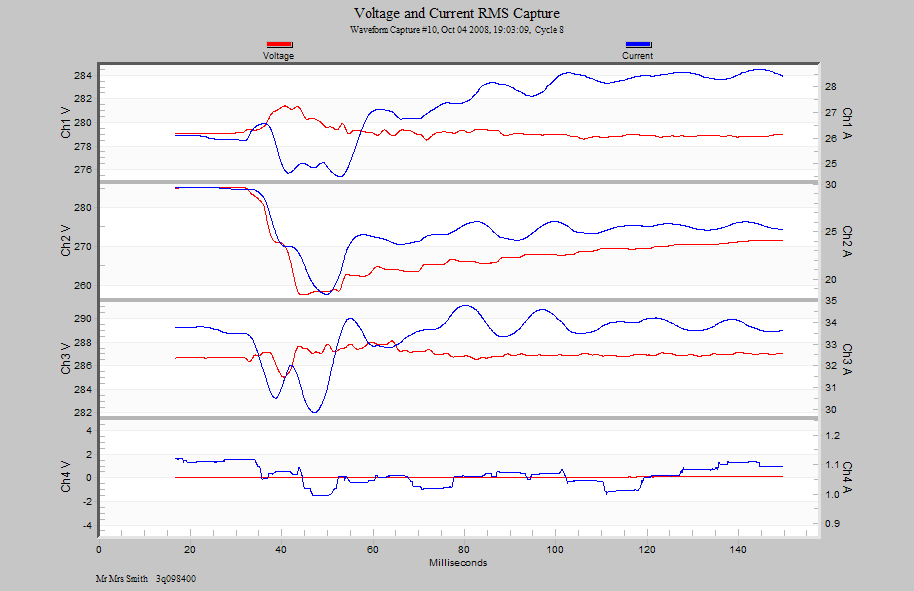
Figure 5 shows a waveform capture of a voltage sag corresponding to the Event Change Table Report in Figure 4. Note that Figure 4 shows a rising event on Channel 2 (as seen by the plus sign), and it corresponds to the rising end of the waveform in Figure 5.
Initial Settings for Typical Uses
Nominal Voltage Setting
For most applications the best way to set the nominal voltage is to actually measure the voltage and set it as close as possible to the actual line voltage. The program’s default is 120 volts, but if the circuit under test is running at 122 volts, the recorder should be set to 122 volts and not 120 volts for the best quality of data. Remember, the event change is not for steady-state line voltage regulation issues, for steady-state line voltage issues use the abnormal voltage report. The Event Capture function is tailored to record data related to quick sags and swells.
Threshold Band Settings
When attempting to set the threshold for initial setup, it is important to set the threshold small enough to catch the problem events, but large enough to avoiding filling up the memory with useless data. A good initial starting point is (+/-) 5% of the Nominal Voltage setting. For a 120 volt nominal voltage setting, this would be 6 volts. This is the program’s normal default. Please note from Figure 1, the Event Capture Setting Window, that the nominal and threshold can be set separately for each channel. If it is necessary to disable an event change on a channel, just set its threshold to something very large, such as 500 volts.
Minimum Event Time
The minimum event time is not as critical as the previous settings. This parameter ideally should be set just larger than the slowest anticipated sag time. For example, if a sag due to a motor start up would take no more than 6 cycles to reach the maximum sag value, then the best minimum event time is 7 cycles. The reason for setting the minimum event time in this fashion is to prevent multiple event changes from occurring due to the same sag voltage. If this is not observed, as the voltage drops lower and lower, past the voltage trip point, the event will continue to trigger the recorder, causing useless data to be stored, thereby wasting memory. The ideal situation is to have only one event trigger for a single sag or swell. The default value is 10 cycles. This is a typical value which is normally longer than most sags take to reach the final sag voltage.
Please note as shown in Figure 2, the Event Change Table Report provides cycle-level details on sags and swells. A sag that only shows up as a single point on the interval graph can be analyzed in the event change report. Event change table report is not usually the first report to be analyzed in a recording due to its complexity. Check the voltage interval graph for minimum or maximum voltages out of tolerance, or the significant change report for voltage fluctuations. If more information is needed on the disturbance, use the timestamp to find the fluctuation in the event change report. Detailed information, such as cycle duration, pre- and post-event RMS currents, etc. is available here. The duration and maximum and minimum voltages are the most useful values. This information shows how long the event lasted, and how high or low the voltage went. The cycle timestamp can be useful to determine how far apart several events were and if they occurred within the same second. The timestamp is also used to correlate an event change with other reports, such as waveform capture and significant change reports.
Studying the pre and post RMS current cycle data can be used to determine if the load being monitored is responsible for creating the sag. If one considers an event change that was triggered by a voltage sag, and the current one cycle before the event is low, but the maximum current during the event is high, and the current one cycle after is high (or at least higher than the pre-trigger current), then the monitored load probably caused the event. In-rush current from a motor start is an event that can produce this exact type of pattern: the high in-rush current pulls the voltage down, triggering an event. When the in-rush current peak is past, the voltage goes back up, causing the event to end. The final current is lower than the in-rush current, but higher than the current before the event.
Now consider another possibility, a voltage sag where the current during the event is lower than the pre-trigger current (or about the same), and the post-trigger current is about the same. In this case the monitored load probably did not cause the event. Some other load pulled the voltage down, and the monitored load current dropped proportionately with the lowered voltage. When the voltage came back up, then the current rose to its normal level also. ProVision and WinScan group closely occurring event change records into super-events.
Super-event
A super-event occurs when an event starts on any channel. The super-event is not over until there are no running events on all channels for at least an entire second. A complicated voltage disturbance may trigger several closely spaced or back-to-back event changes, but they will be grouped into one super-event for easier analysis.
Event change is always recorded separately for each voltage channel. If event change memory is filled, event change recording immediately stops. The same event change memory is used for all voltage channels. The amount of memory used for event change is different for various PMI recorders. The Revolution recorders for example can record over one thousand records.
Summary
- An Event Change Report should be implemented if there is a power disturbance on a cycle basis that needs to be recorded.
- The Nominal Voltage default is 120 volt. The Nominal Voltage setting should be changed to the actual measured voltage during installation for best results. The Event Capture function is tailored to record data related to quick sags and swells, not for monitoring steady-state line voltages.
- The Threshold Band default is 6 volts. A good initial starting point for the Threshold Band setting is +/- 5% of the Nominal Voltage. It should be set to a value small enough to catch the problem event, but large enough to avoid filling up memory with useless data. If it is necessary to disable an event change on a voltage channel, just set the threshold to a very large value such as 500 volts.
- Minimum Event Time default is 10 cycles. This parameter ideally should be set just larger than the slowest anticipated sag time.
- A super-event occurs when an event is triggered on any voltage channel. The super-event is not over until there are no running events on any channel for at least an entire second. Event change is always recorded separately for each voltage channel.
- The same event change memory is used for all voltage channels. If the event change memory is filled, the event change recording stops.
- The Event Capture function was developed before the Waveform Capture function, and is basically a substitute for the waveform capture in PMI’s recorders that cannot record raw waveforms, or used in situations where many events may be generated. The event capture function has the advantage of using much less memory than the waveform capture function.
