Abstract
True power factor (PF) and displacement power factor (DPF) are commonly available on power analyzers and loggers. Although useful on their own, together they can help estimate current THD, even on a device with no harmonic measurement ability. The underlying theory is presented here, along with some real-world examples.
True power factor is the ratio of real power to apparent power, and as detailed in the whitepaper Formulas for Power and Harmonic Measurements, can be expressed as:
where W is the real power over at least one cycle, and VA is the apparent power, or RMS voltage times RMS current. This is the “true” power factor because it includes the effects of harmonics (and interharmonics). All non-60Hz components are accounted for in the calculation of RMS values, and also in computing real power, since both computations use all parts of the instantaneous waveform.
In contrast, the displacement power factor (DPF), is the “power factor” of just the 60Hz fundamental, computed as the cosine of the phase angle between the current and voltage fundamental sine waves:
No harmonic or interharmonic components contribute to this value, and their presence doesn’t affect the result. As mentioned in the Formulas whitepaper, if “DPF ≠ PF, then harmonics must be present.” Here this statement is expanded upon and quantified.
Continuing the notation in Formulas, and following the derivation in Harmonics and How They Relate to Power Factor, PF can be expressed in terms of the real power, voltage and current fundamentals, and the voltage and current THD values:
Here VMAG[1] and IMAG[1] are the voltage and current fundamental magnitudes, and VTHD and ITHD are the total harmonic distortion values, referenced to the fundamental, and normalized so 1.000 = 100%.
Looking at this expression, we see that PF depends on the voltage and current THD, in a nonlinear fashion. For a fixed fundamental magnitude, as either THD increases, the PF value lowers. For example, if ITHD = 10% (or 0.1 in the formula), its contribution is 1/sqrt(1+0.1²) = 0.95, or very little. If the THD increases to 60%, the factor is 0.86. If the harmonics are all zero, the THD values are both zero, and the fundamental magnitudes are the same as the RMS values, resulting in the PF equaling the DPF. In real applications, the THD is unlikely to change without some change in the fundamental, but this expression is useful for separating the effects.
Given that the PF generally gets smaller as the THD increases, but the DPF is unchanged, it should be possible to examine PF and DPF to estimate THD, or at least make an educated guess that the THD could be high. To test this theory, a recording was made in the lab with a PMI recorder, a stable AC power supply, and a nonlinear load (halogen lamp with dimmer). The light dimmer operates by adjusting the conduction angle during the waveform, and by adjusting the dimmer, the current THD may be continuously varied.
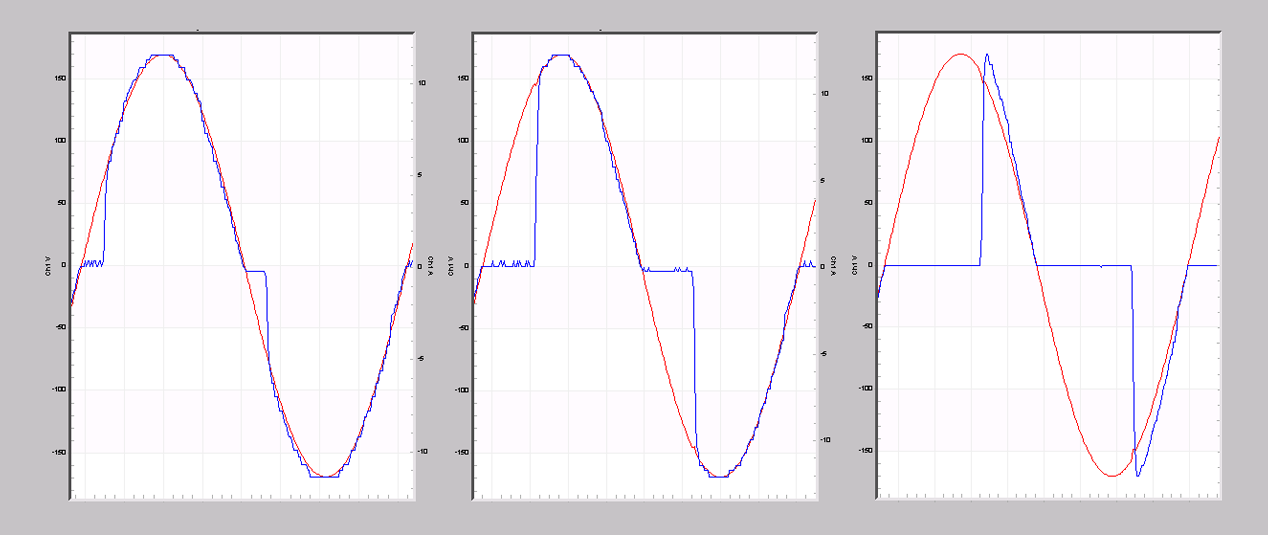
The light was transitioned gradually from 100% on to fully dimmed, thus increasing the current harmonic content. Typical waveforms with different conduction angles are shown in Figure 1. The voltage waveform was largely unchanged, but the current is rich in harmonics with smaller conduction angles.
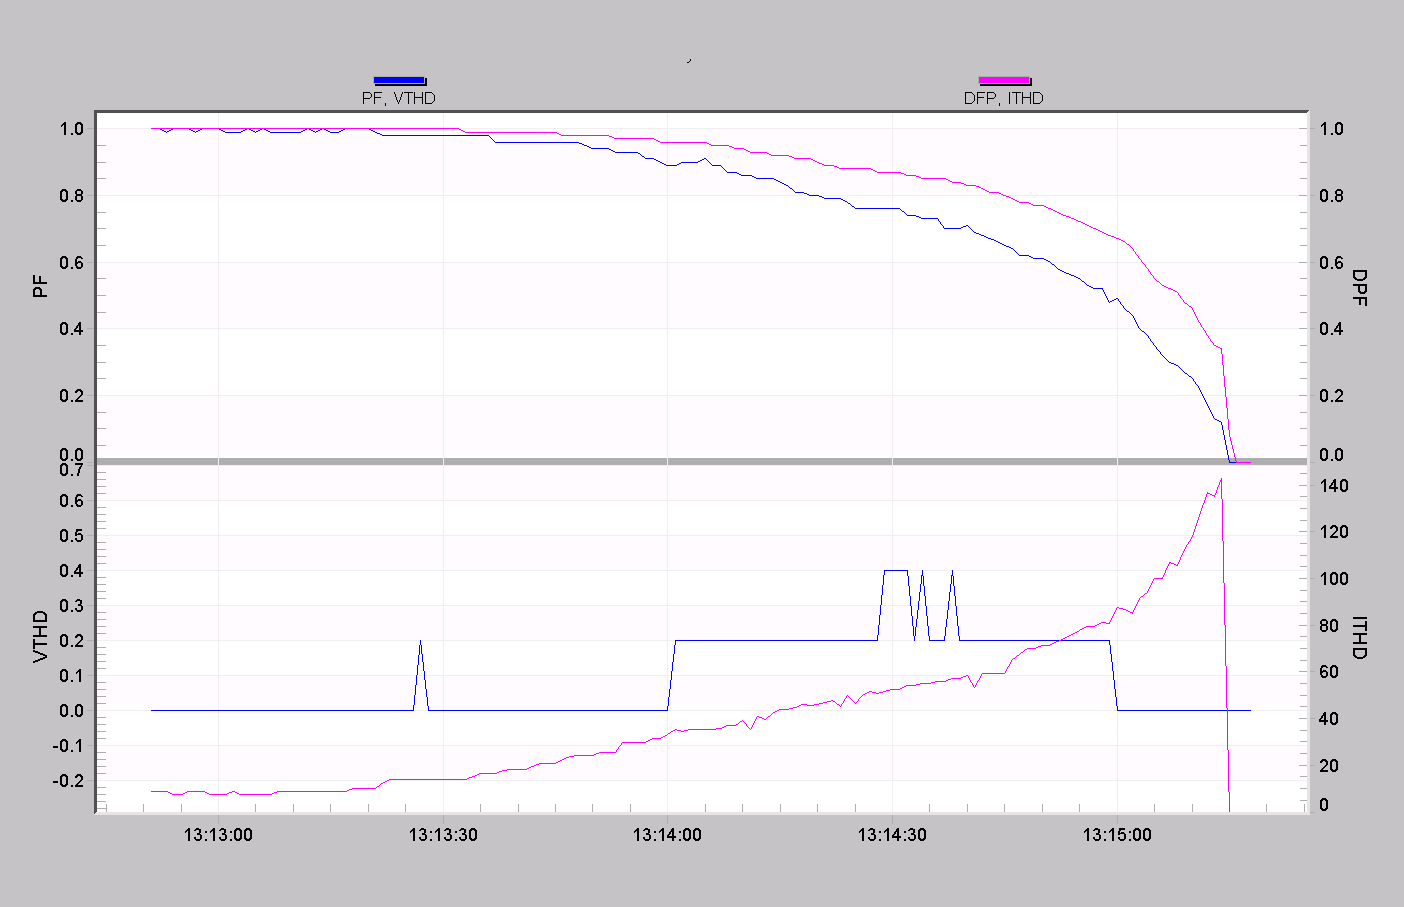
The results are shown in Figure 2. The top plot in Figure 2 shows PF (blue, left axis), and DPF (pink, right axis). The bottom plot is voltage THD (blue, left axis), and current THD (pink, left axis). At the start of the graph, the light was fully on, with minimal harmonic content. Here, PF and DPF are both very close to 1.00, and the current and voltage both close to zero. As the light is gradually dimmed, the current THD increases to over 120% THD (as read from the right axis on the bottom plot), while PF and DPF start to separate. They both decrease, due to asymmetry in the conduction angle timing relative to the center of the 60Hz waveform, but PF decreases more than DPF, and the separation increases as the THD increases. This movement is consistent with that expected from the PF formula above. The voltage THD was close to zero the entire time, due to the stiffness of the voltage source; thus voltage THD isn’t a factor here.
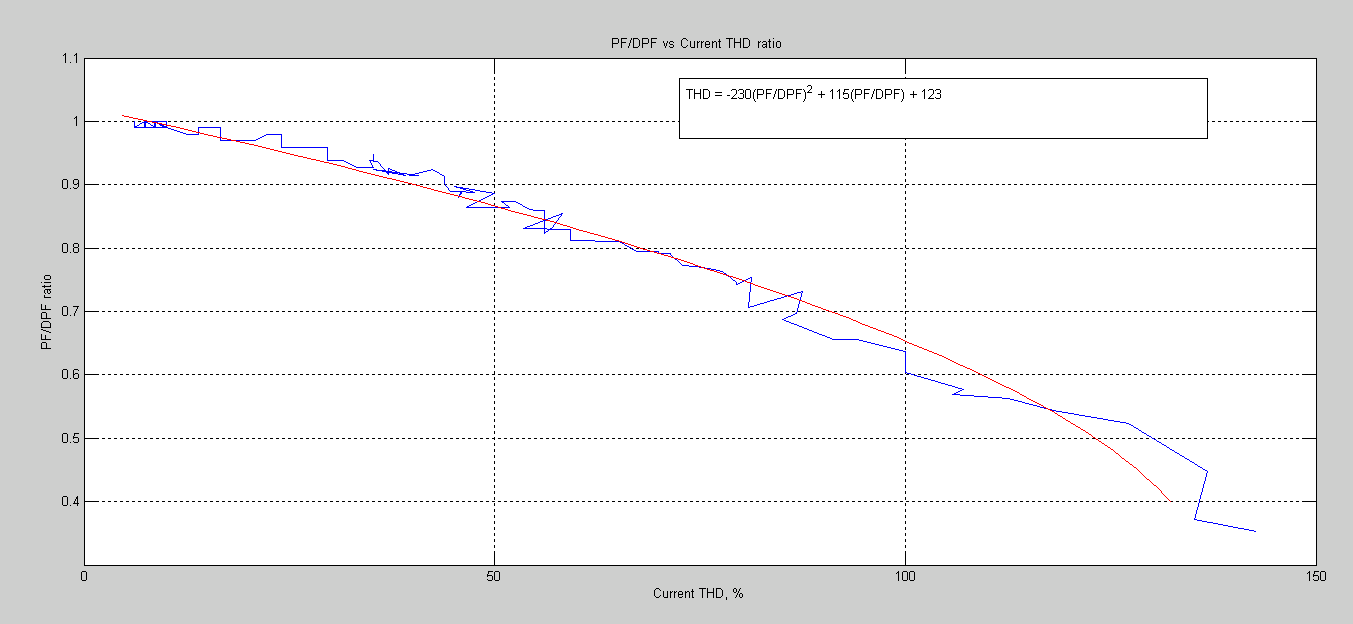
Next, the data was exported from ProVision to MATLAB for a more detailed analysis. Since the harmonic influences on the PF away from the DPF value are multiplicative, the PF/DPF ratio was used, instead of the arithmetic difference. This ratio was plotted as a plot with the current THD (Figure 3). The blue trace is the raw plotted data from Figure 2, with current THD on the x-axis, and the PF/DPF ratio on the y-axis. Given the square root in the THD factor for PF above, a second order polynomial was chosen to fit the data. The best-fit quadratic is shown in red, and the fit looks reasonably good. The best-fit equation is shown in the graph, and gives this relation between the measured PF/DPF ratio, and estimated current THD:
Note that this would apply to voltage or current THD, but here (and often in general), we can assume the voltage THD is much less than the current THD. As an example, from Figure 2 at 13:14:00, the PF is 0.89, and the DPF is 0.96, giving a ratio of 0.89/0.96 = 0.927. Plugging 0.93 into the above formula gives 32% for the estimated THD. The actual THD from Figure 2 is 33.3%, a close match.
The above empirical formula is only strictly valid for the particular load in the experiment. The fundamental current and real power also varied with the dimmer position, and thus the curve fit may be valid for other types of loads. However, the principle of examining the PF/DPF ratio for estimating THD is still sound, and the formula can be used for a rough order-of-magnitude estimate. To validate this idea, a collection of real-world recordings was examined.
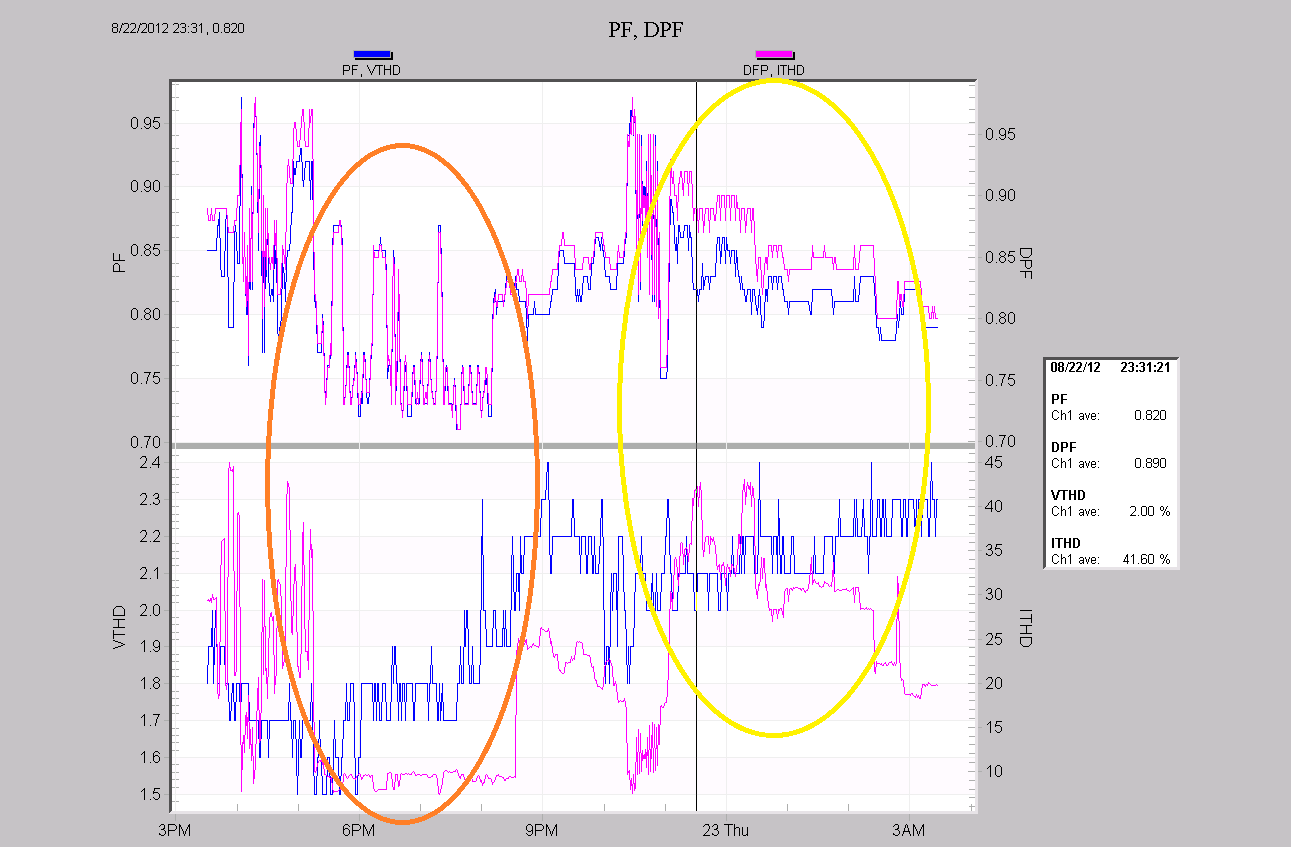
In Figure 4, a residential location is plotted, with the same parameters as Figure 2. In the orange circle, the current THD is low, around 5%, and the PF and DPF in the top plot are almost identical. In the yellow circle, the current THD is between 30 and 40%, and the PF (blue) is now lower than the DPF (pink). Picking a point at 23:31:21, the PF = 0.82, and DPF = 0.89. Plugging these in to the formula gives an estimated THD of 34%, within the ballpark of the actual 42%.
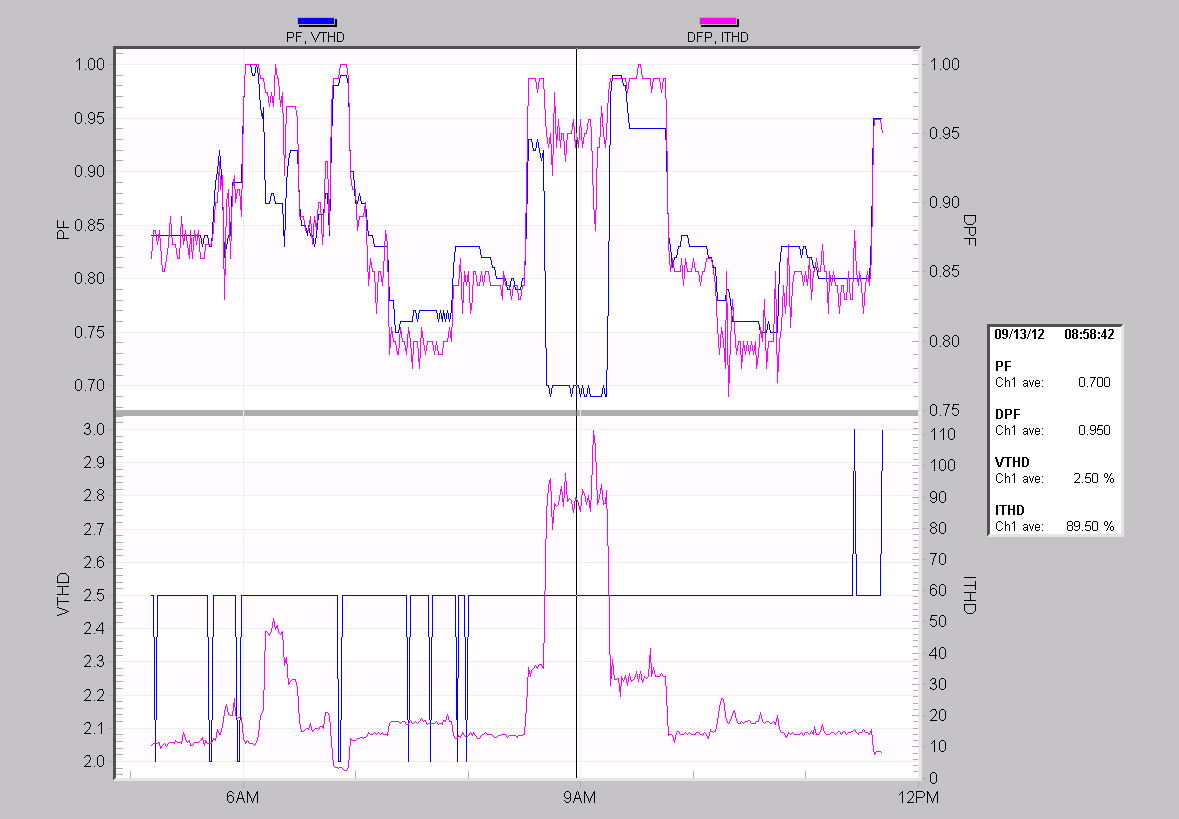
Another example is shown in Figure 5. Here the PF/DPF ratio is much worse, and so is the current THD. The step changes in current THD are exactly in line with the separation between PF and DPF, showing the clear relationship. At 8:58:42, the PF is 0.70, and DPF is 0.95, giving an estimated THD of 83%, reasonably close to the actual 90%. Picking another point on the graph, where the THD is low, gives PF = 0.83, DPF = 0.86, and estimated THD of 19%, not far from the actual 13%. As the PF becomes closer to the DPF, the effect of only having two significant digits plays a larger role in the estimation error – changing the PF from 0.83 to 0.82 in the last example changes the estimate from 19% to 16%.
Finally, a sample file with low THD is shown in Figure 6. The current THD is under 4%, and the PF and DPF values are essentially identical.
The THD estimation formula can give a reasonable guess for current THD with just PF and DPF information. For situations where the voltage THD is much less than the current THD, and where the current THD is over around 10%, the estimate is often within around 5 or 10% of the actual value. A better estimate could possibly be formed by experiment or analysis of different waveform shapes than the light dimmer used here (e.g. a 6-pulse VFD converter), but even the simple dimmer shape produced reasonably close results to real-life examples. In situations where the voltage THD was comparable to the current THD, the current THD estimate would be less accurate, but the method would still indicate that harmonics may be a problem.
Conclusion
A method was shown to estimate THD in recordings where no harmonic information was captured, or with monitors that can measure PF and DPF, but not harmonics. If real, reactive, and apparent power are measured, PF and DPF can be computed from those quantities, and then THD estimated. This harmonic information is extracted ultimately from the fact that true PF contains implicit harmonic information from the real and apparent power values, while DPF is harmonic-free.
