Abstract
Several months ago PMI purchased a Nissan Leaf all-electric vehicle. The Leaf has an approximate range of 90 miles which fits well with our day to day usage for local errands and occasional employee use. It also serves as a real-world example of a rapidly expanding technology. This whitepaper will examine some of the various affects that electric vehicle charging may have on power quality, using the Leaf as an example. Data from a Revolution, Tensor, and Boomerang are shown, illustrating the current and power characteristics as well as the effect on the service voltage. The issues here are mostly from the perspective of the end-user. Distribution level PQ problems from widespread EV deployments are the subject of another whitepaper.
Equipment and Setup
The Leaf can be charged from a standard 120V outlet (Level 1 charging) or using a separately purchased 208/240V charging station (Level 2). This whitepaper will examine data gathered from both types of charging. The examples shown below were taken from recordings and Canvass data using various PMI products during charging cycles of the Leaf. A Revolution was used to capture 3-phase data from the circuit powering the Level 2 charging station. This data includes voltage, current, power, total harmonic distortion (THD), voltage unbalance and flicker along with some waveform captures. A Boomerang reporting to Canvass was used to capture voltage, current and power as measured across the two voltage phases of the 208V charging unit. A plug-in PMI recorder was used to capture voltage, current, power, THD and flicker along with some waveform captures when the charging was done via a 120V receptacle.
The charging station is a Clipper Creek CS-60, connected to a 60A double-pole breaker in a 200A subpanel. This connection is through 90 feet of 6 AWG copper wire. The subpanel is fed from an 800A main panel, and the service entrance is three phase 120/208V, fed from three 50kVA transformers. The Leaf’s Level 2 charger input is rated at 6.6kW, and would normally require just a 40A electrical feed. We chose a 60A-capable system for future expansion with other EVs. Because of the oversized wiring (60A instead of 40A), the voltage effects seen here are less than might be seen with smaller wire (smaller wire = more voltage drop). The Leaf Level 2 input is fed from two legs of the 120/208V wye, providing 208V into the car.
Steady State Charging
As might be expected during a charging cycle the current and power drawn is essentially constant for the majority of the time on the charger. Of course the levels and time are different between the two types of charging (208/240V vs 120V) but this is also as expected. Figure 1 shows a custom graph created in Provision from a Revolution recording of the entire charging cycle. We see the expected voltage sag to go along with the relatively high current being supplied to the vehicle’s batteries. Notice the immediate change in voltage when the charging cycle starts and the gradual recovery as the cycle ends.
The voltage drops about 1.6V, or 1.3%, when the charge begins. This 1.3% drop could be a concern during peak demand, or if Volt/VAR programs are in place that provide a lower service voltage. The charge current is 30A, as specified by the Leaf. The current appears to be independent of the voltage, and a 240V input would also result in 30A charge current.
Figure 1a also shows the voltage unbalance as measured by the Revolution. Voltage unbalance is the largest difference between the average RMS voltage and the RMS value of any single voltage phase. The Revolution has recorded the two voltage phases on the charging station plus the third voltage phase of the building (unused by the charging station). Therefore, the vehicle charger’s load on two phases but not the third is the cause of the recorded voltage unbalance. Note that the recorded charging cycle was purposely delayed until the middle of the night (1:00am to 4:30am on the graph) in order to better capture the unbalance attributed to the vehicle charging.
The voltage unbalance shows a 0.5% step increase when charging begins. This is due to the 30A current on two of the three phases. For a smaller service, the resulting unbalance could be much more significant, but is noticeable even here. In a residential Level 2 situation, the entire 240V would be fed to the car, and the unbalance would appear on the 3 phase primary side.
Compare the voltage and current data as recorded by a Revolution in Figure 1a with the voltage and current stripchart data taken from Canvass, PMI’s cloud storage and analysis system, in Figure 1b. A single phase Boomerang is connected to the Level 2 charger and is continuously reporting one second values to the Canvass servers. This data is available from any web browser and can often be used to evaluate and solve issues without having to deploy a recorder or download data. The RMS voltage, current, and power data are essentially identical in the Revolution and Boomerang for this load.
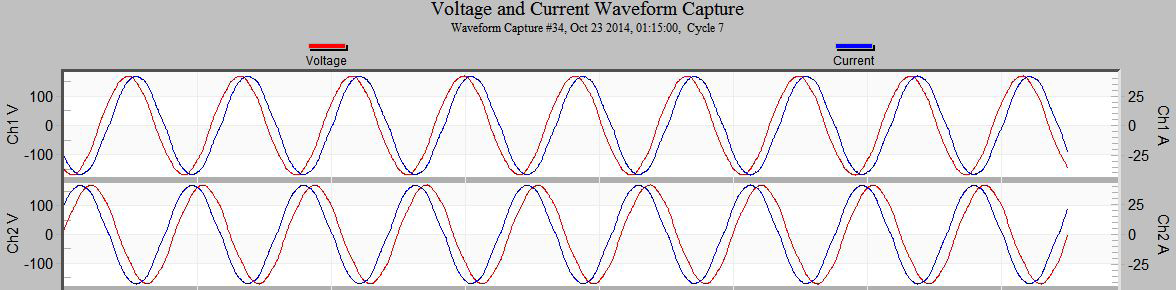
The steady state portion of the charging cycle is also characterized by near perfect waveforms with only slight leading or lagging effects as shown in Figure 2. Voltage unbalance and possibly low RMS voltage are the only two likely PQ issues during this portion of the charge. The 30A current is very steady with relatively low distortion (around 3% THD).
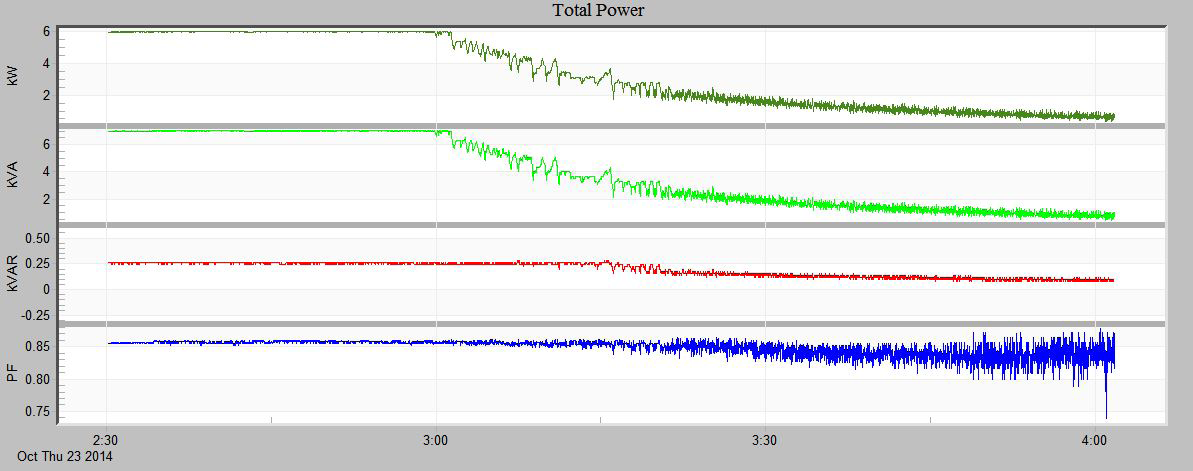
The waveforms indicate a nice linear load during steady state charging and the total power graph shown in Figure 3 bears this out. Notice the high power factor during the early steady state portion of the graph up until the charge cycle is close to completion (3:00 on the graph). At this point the charging circuit of the Leaf has detected that the charge is nearing capacity and begins to taper off the current drawn as it enters into the end of the charging cycle. The power factor for most of the charge cycle is around 0.85.
End of Charging
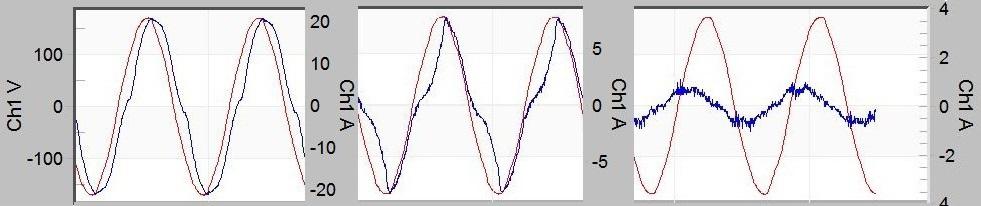
The end of the charging cycle is where the action is. This period is characterized by a gradual reduction of charging current over an extended period of time exceeding 1 hour. During this time several power quality issues can be observed to varying degrees. Figure 4 shows a sequence of waveforms taken from the period where the current is tapering off. Notice from the previous figures that the reduction in current is not linear but more of a stepping up and stepping down of the current. In addition, the waveform shape itself becomes more distorted as seen in the sequence of images taken from various points during the final phase of the charging cycle (Figure 4). In the middle waveform, the THD is around 25%.
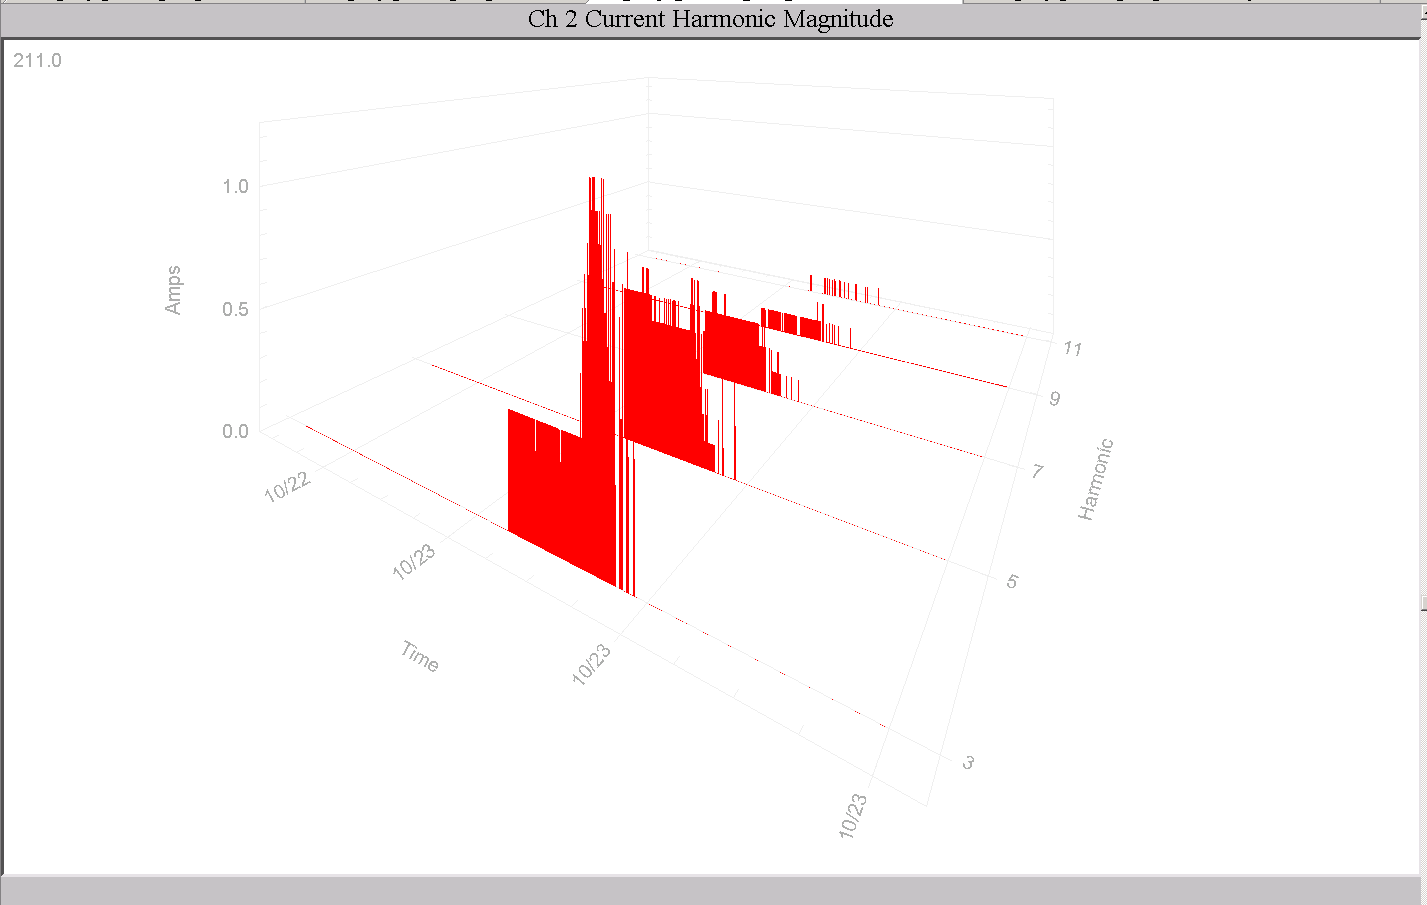
As the current decreases, the THD increases. As the 3D graphs shows in Figure 5, the 3rd harmonic is highest, followed by the 5th. The fundamental is turned off in the graph and the 3rd peaks at around 1.2A RMS.
The Level 2 charger at PMI was installed on its own circuit with sufficiently large conductors to allow for upgrades or additional chargers. For this reason the effects due to voltage fluctuations (THD or flicker) during the end of the charging cycle are seen to be minimal based on the Revolution recording. The current fluctuations could present more of a problem in a smaller commercial setting, by producing voltage drop in the wiring. The 30A load is around 7% per unit for the 150 KVA service. The effect on a smaller service would be proportionally higher.
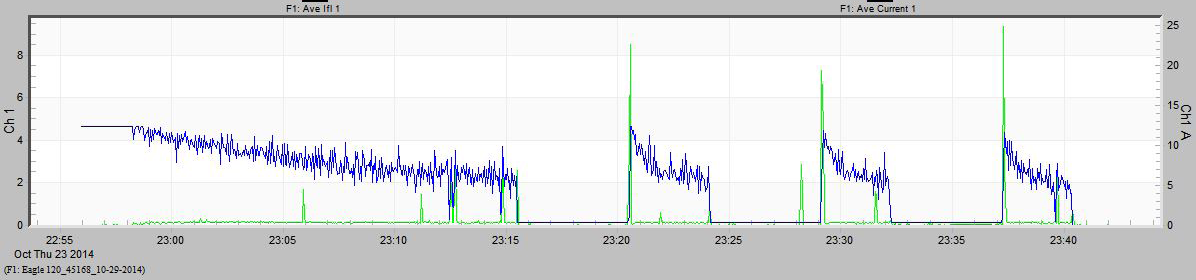
When the charging is being done on a residential 120V outlet the current fluctuations are even more likely to affect the measured power quality. Flicker can easily be noticed in a residential setting depending on the wiring and circuit loads. A PMI recorder was used to capture the recording shown in Figure 6. It show that the Pst flicker increases as the current decreases at the end of the charging cycle. The overall effect on service voltage with Level 1 charging is likely limited to the circuit feeding the car itself so any flicker effects will be limited in scope.
Conclusion
The Nissan Leaf charge characteristics have been measured and presented in both Level 1 and Level 2 scenarios. In Level 1 (120V) situations, the current is low enough that individual voltage and harmonic effects are, at most, limited to the branch circuit that feeds the car. For Level 2 systems, especially in 3 phase commercial installations, voltage unbalance is the most likely issue to be a problem, followed by low voltage. Current harmonics or flicker could be a problem with sensitive equipment.
