Abstract
Harmonic distortion is an increasingly common power quality problem, and one of the most complex to analyze. Going beyond the total harmonic distortion to assess each individual harmonic takes time, but is sometimes required to track down the source, and also to determine a mitigation strategy. Harmonic bar charts show all harmonics at a glance, but give no trending information about how harmonics vary with time. The ProVision 3D harmonic graph shows all recorded harmonics vs. time, but can display too much information at once. Creating custom graphs in ProVision for each harmonic can take time, especially for 51 voltage and current sources.
Harmonic Graph Templates
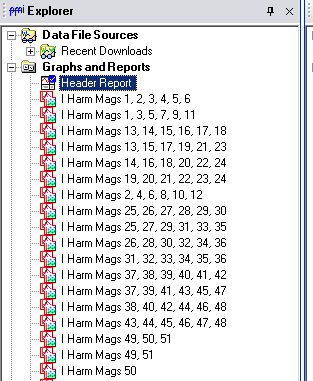
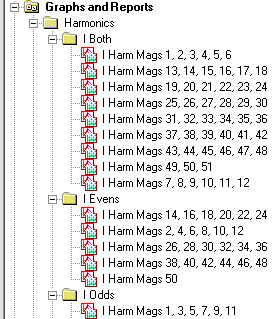
To allow for a quick method of viewing all harmonic trends, ProVision now offers powerful, easy-to-use new graph templates for viewing individual harmonics. These templates may be downloaded and imported into ProVision by clicking here. After the file is downloaded, double-click it in Windows Explorer, or chose File > Open in ProVision to import the new graphs. After the import, they are available as graph and report templates (Figure 1), and can be used on any existing recording with the required data. To launch a graph, simply open a ProVision data file, then either double-click the graph in the Graphs and Reports Tree, or select Graph > Custom Graph from the menu. To view the data in tabular report format, select Report > Custom Graph Reports from the menu. To help organize the new templates, it may be helpful to create a Harmonics folder, and subfolders for the different graphs types, as shown in Figure 2.
These are stripchart graphs of individual voltage and current harmonic magnitudes. The points are the averages, and are over the selected stripchart interval period defined when initializing the recorder. The average was picked instead of the max or min values, since harmonics are most meaningful as steady-state values (in the short term).
All the new harmonic templates are defined in the same pattern; an example is shown in Figure 3. Each graph contains six plots, and each plot is dedicated to a single harmonic. Within each plot, the specific harmonic is plotted as a stripchart for up to four channels of voltage or current. The first three channels use the left Y-axis scale, and the fourth channel uses the right Y-axis scale. Channel 4, usually the neutral-ground channel, is separated on its own axis so it doesn’t interfere with the autoscaling of the three phase channels– this way, all four channels appear in the same plot, but the three phases are autoscaled together, and the neutral is autoscaled independently.
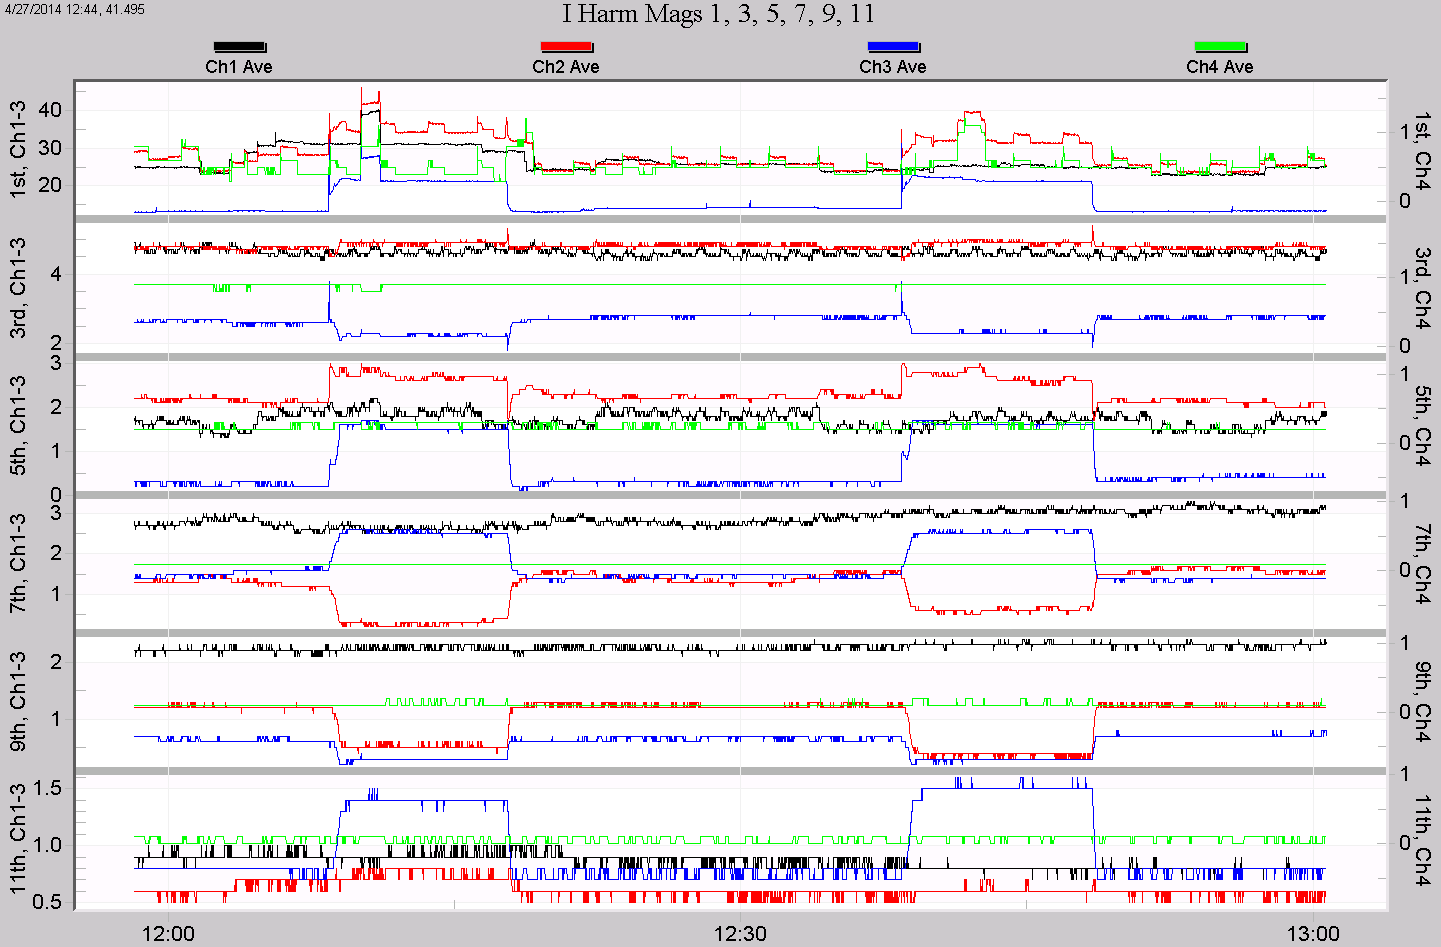
In Figure 3, the “I Harm Mags 1, 3, 5, 7, 9, 11” graph is shown from a 3-phase recording. The 1st harmonic (the 60Hz fundamental) appears on the top plot, and channels 1, 2, and 3 (phase A, B, and C current) are scaled with the left axis, here from 0 to 40A. Channel 4, the neutral, is much smaller and is autoscaled to just 2A full scale, even on the fundamental. The channels are colored black, red, blue, and green, for channels 1 through 4. The other plots are similar, but focus on a different individual harmonic. This graph shows odd harmonics from the 1st through the 11th. The other graphs either show odd harmonics, even harmonics, or both. In most cases, only the odd harmonics are significant, and the graphs with just odds (starting with 1-11) should be the first to be examined. If even harmonics are possible, then the even-only graphs can be generated. The graphs showing both together (e.g. “I Harm Mags 1, 2, 3, 4, 5, 6”) are useful if correlations between even and odd harmonics need to be viewed together.
Harmonic Plots
Each harmonic is given its own plot so that autoscaling is most effective. Since different harmonics may have significantly different steady state levels, mixing different harmonics on the same Y-axis can create graphs where one harmonic dominates the plot and the others are difficult to see. In all these graphs, each harmonic is on a separate plot/Y-axis and channels are combined on a plot instead.
All harmonics from the 1st through the 51st are available in the templates. A series of templates for just the odds from 1-51, the evens from 2-50, and all harmonics are defined for both voltage and current magnitudes. Just 5 graphs are needed to examine all odd harmonics from 1-51 for all channels. The voltage graphs are defined just like the current – same color scheme and harmonic layout. Channel 4 is also scaled from the right Y-axis, in order to avoid spoiling the autoscaling on the main phases. If a harmonic or channel was not recorded, those traces simply do not appear in the plot. There is no need to record all 51 harmonics for all channels to use these graphs – if any harmonic data is available, they will be graphed from the applicable template, but if any data is not recorded, it simply is not graphed.
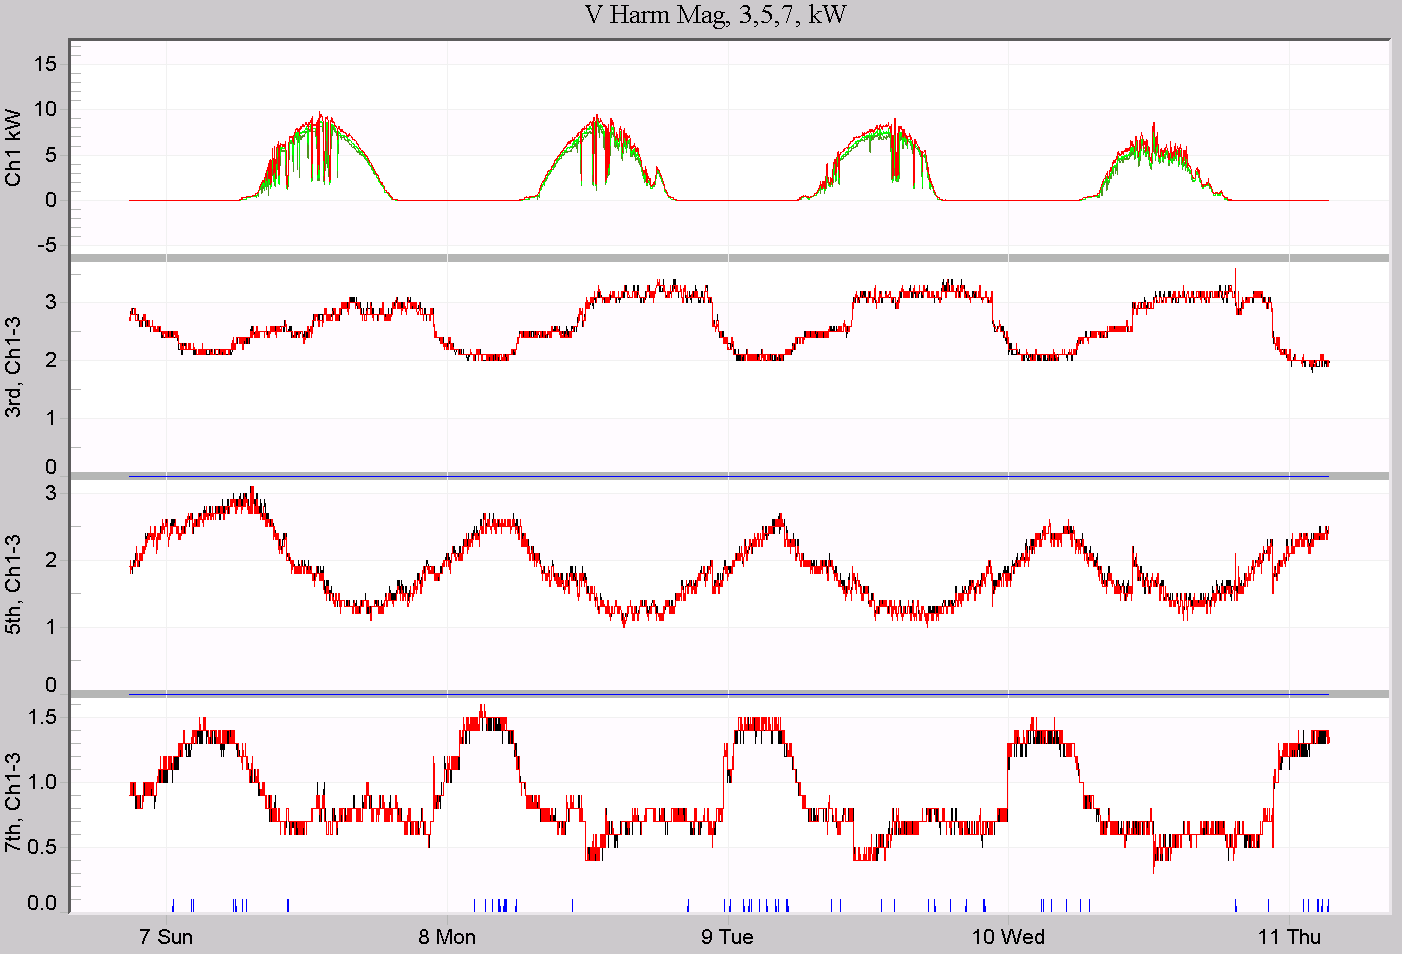
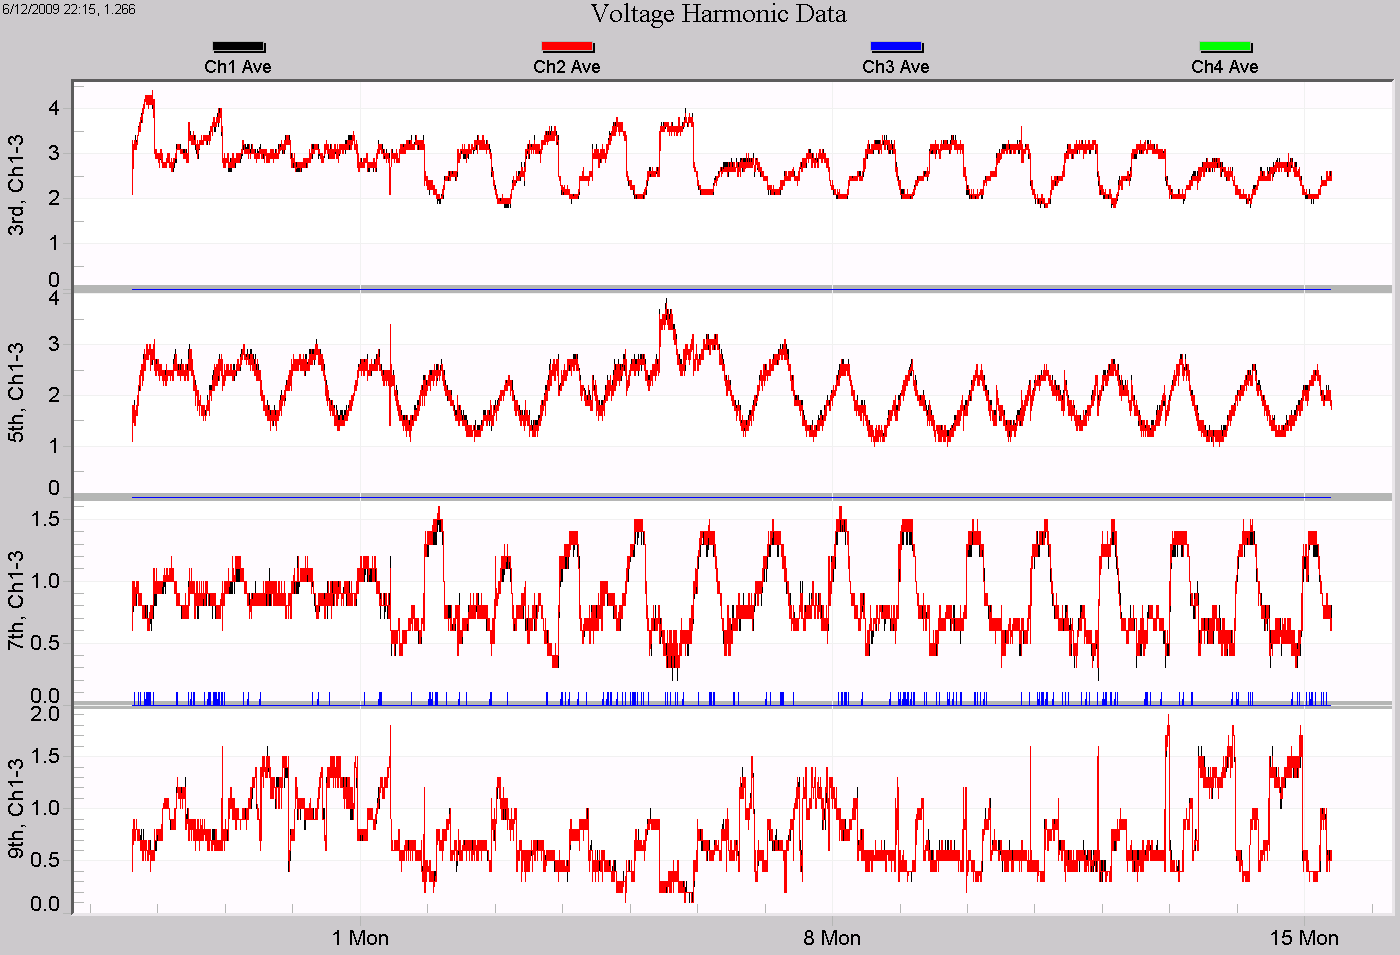
In Figure 4, the “V Harm Mags 1, 3, 5, 7, 9, 11” graph is shown for a 20kW single-phase photovoltaic system. Channel 4 was not recorded, and only the 3rd through the 9th odd harmonics were enabled. The daily variation in harmonic content on the 3rd, 5th, and 7th harmonics are clearly visible.
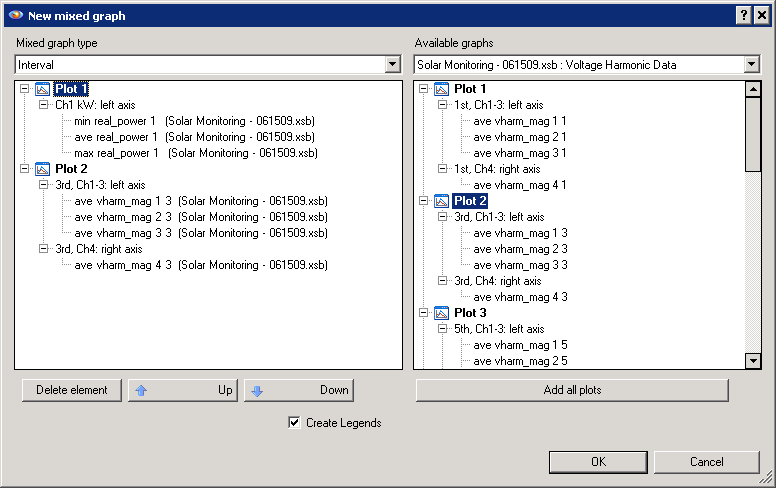
These graph templates may be combined with other existing ProVision graphs for more advanced analysis using the graph mixer. For example, it would be useful to see real power along with the voltage harmonics in Figure 4 to more closely examine the correlation. With both those graphs on the screen, Choose Tools > Trace Mixer Graph, and use the dialog to drag plots from either graph into a new graph (Figure 5). The resulting graph using harmonics 3, 5, and 7 is shown in Figure 6 (zoomed in to just a few days). These mixed graphs may be saved as templates for re-use later. Using the new harmonic templates is a quick way to mix harmonics with other built-in ProVision graphs, and to create new custom templates, combining harmonics with any other stripchart data. Several custom graph templates have been created for easier and more advanced data analysis of harmonic trend data. These templates allow for easy graphing of specific harmonics, and can also be used as starting point for creating even more customized graphs with harmonics and other data types.