Abstract
A loose neutral is not obvious to the naked eye but can lead to significant damage. The symptoms vary widely, and proper detection is essential to mitigation. This paper gives a brief overview of loose neutrals and the damage they can cause, then demonstrates how to find them using a socket PQ recorder and PQ Canvass.
Loose Neutrals Basics
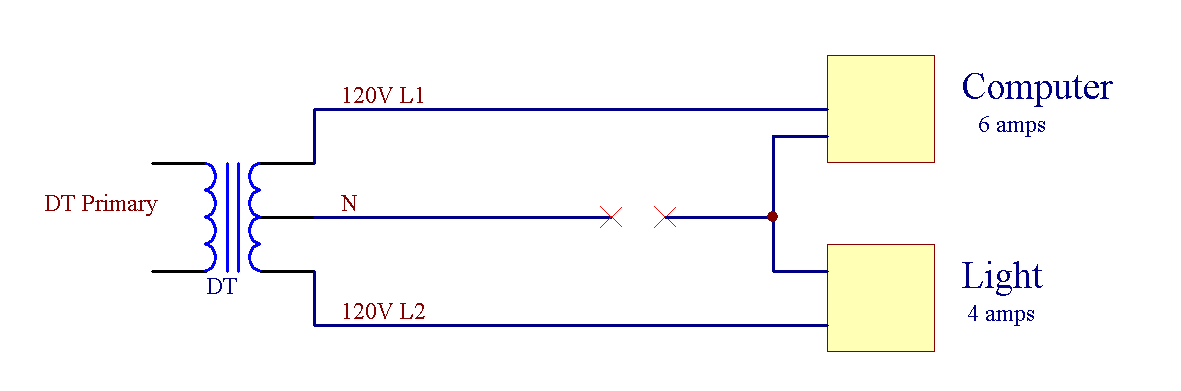
A loose neutral occurs when the connection between the neutral wire and the transformer secondary is loose or broken. Figure 1 shows a simplified circuit containing a transformer, two loads, and a loose neutral in a single phase system. When the loads are equal, no current flows on the neutral wire. When the loads are not equal, the neutral carries the difference between the load currents back to the centertap of the transformer. In this example, the neutral wire is damaged as indicated by the red x marks.
Loose neutral symptoms vary with both the amount of damage to the neutral connection and the severity of unbalance between the two loads. Voltage at the loads can fluctuate, causing issues for equipment expecting a consistent supply of power. Current imbalance can cause breakers to trip. Overvoltage and excessive current can lead to conductors overheating, melting insulation and starting fires.
Instead of the neutral tap creating two separate voltage legs, the voltage divider formed by the loads defines the two leg voltages. The legs combined will equal the total from the transformer. If the loads were perfectly balanced, the voltage on both legs would be equal. However, if one leg is “high”, the other leg must be “low” to compensate. Since the symptoms of a loose neutral are diverse, it is best diagnosed by looking at the data rather than trying to divine through intuition.
Seeing the Loose Neutral
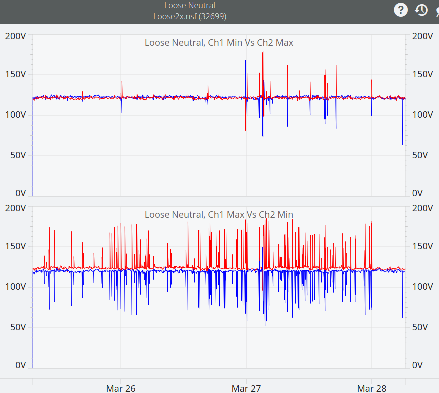
This case where one leg is “high” and one is “low” is difficult to detect with a multimeter, and is best viewed in stripchart form. For example, see Figure 2, real data from a circuit with a loose neutral. The top stripchart graphs minimum channel 1 against maximum channel 2 RMS voltage. The bottom stripchart graphs maximum channel 1 against minimum channel 2 RMS Voltage. Note that when one spikes “high”, the other drops “low”, but that the total is constant across the two loads. Note also that the same leg is not always the “high” leg. This stripchart demonstrates a classic loose neutral pattern, where a voltage swell for one load is matched by a voltage sag on the other load.
Using a Guardian to Identify Loose Neutrals
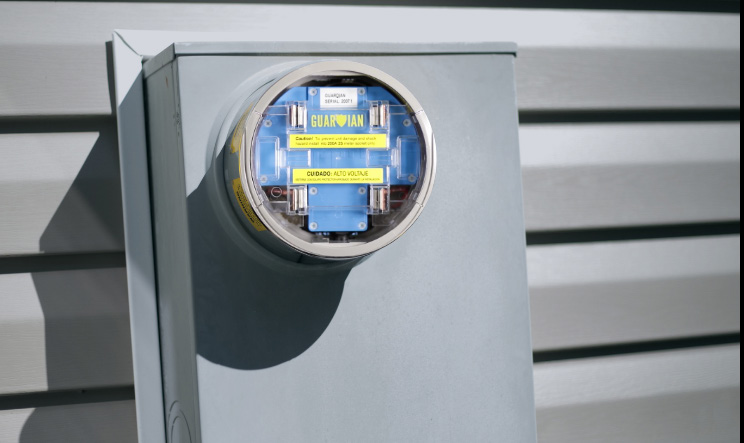
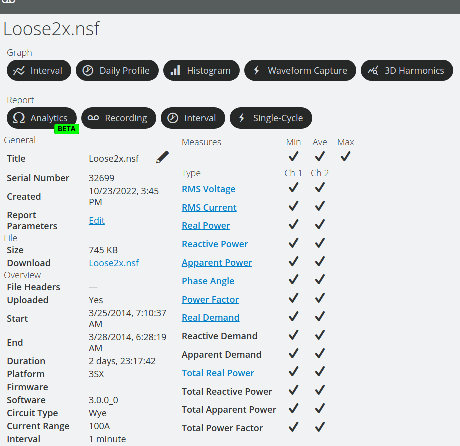
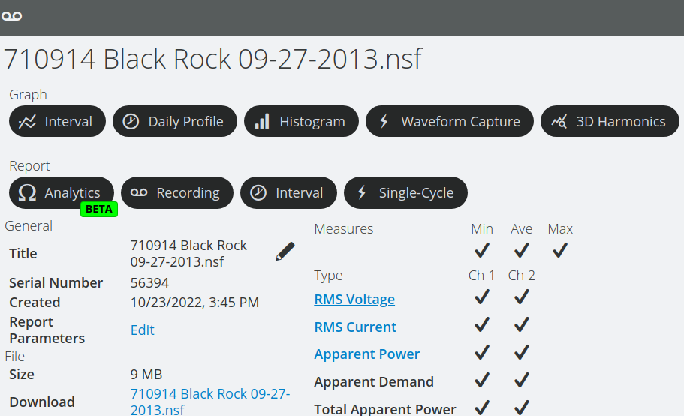
In order to see the voltage sags and swells, the data must be recorded. The Guardian, shown in Figure 3, is a full PQ recorder designed for use in standard meter socket housings. The Guardian streams recording data to PQ Canvass where data can be viewed and analyzed from any device with a modern internet browser. The above graph showing minimum channel 1 against maximum channel 2 RMS voltage on one chart and maximum channel 1 against minimum channel 2 RMS voltage is a predefined template in PQ Canvass. To find from the recording header report (see Figure 4), choose “Graph” from the “Interval” section at the top of the page. Then choose “Loose Neutral” from the “PQ Templates” section of available graphs.

You can also configure a Guardian to record loose neutrals it can identify during recording. To configure this report while setting up the recording, open the “Event Capture” section of the recording initialization settings.
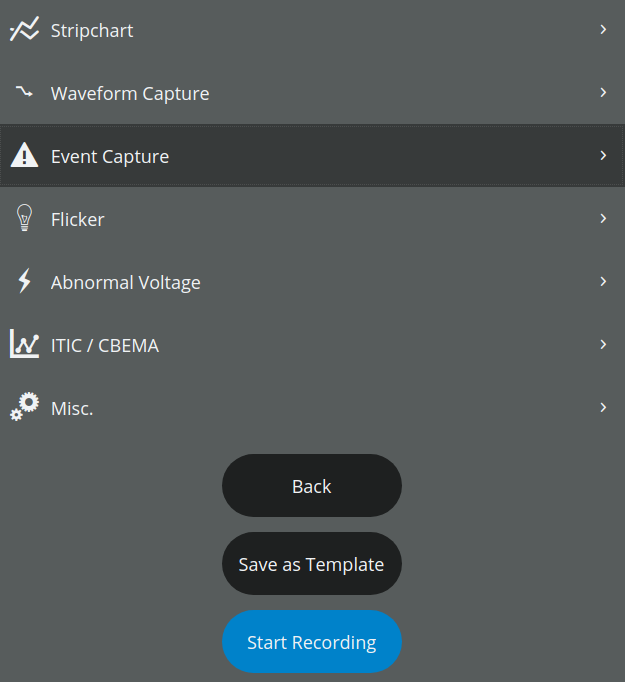
In the “Loose Neutral” section, you can configure the following options: Minimum Time, Voltage Range, Channel Difference.
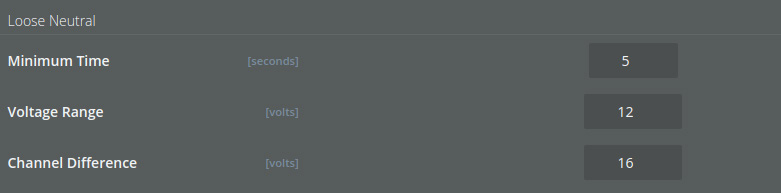
Minimum Time is the number of seconds before determining a loose neutral, default is 5 seconds. Voltage Range is how close the sum of the two legs must be to twice the nominal voltage, the default is 12 volts. Channel Difference is the difference between the channels, 16 volts by default. To detect a loose neutral automatically, both the Voltage Range and Channel Difference must be met for at least Minimum Time to record an event.
To view whether the unit has recorded any loose neutral events, first choose “Recording” under the “Report” section of the recording header report. Then select “Loose Neutral” to open the loose neutral report.
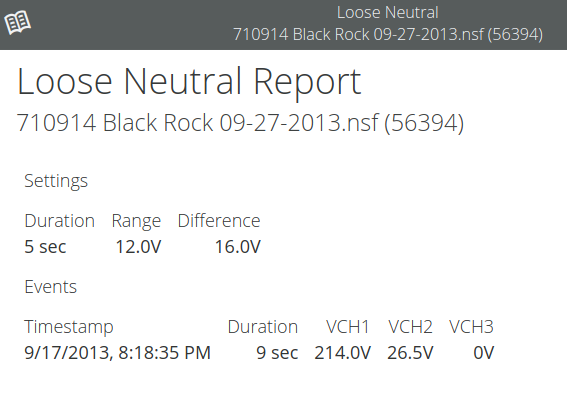
The Loose Neutral report lists the settings chosen for the recording at the top, then lists any events which match those criteria during the recording. Each event lists the start time and duration of the event, followed by the average voltage on each channel during that time. In this example, a 9 second loose neutral event was detected where the voltage on channel 1 rose to 214 volts while the voltage on channel 2 sagged down to 26.5 volts, quite a significant number considering the nominal voltage of 120 volts.
Further Considerations and Reading
In many cases, especially those with a persistent open connection on the neutral line, the patterns described above can be observed in stripchart data or the Loose Neutral report for a PQ recording. However, cases involving well-balanced loads, alternate current paths through a ground, etc. can hide the pattern of a loose neutral. More subtle indications that a loose neutral is present or developing may be observed in waveform capture data. If spotted at the sub-cycle duration, a loose neutral may be addressed before serious symptoms are presented.
For further reading on spotting loose neutrals with waveform captures, see Spotting Loose Neutrals with Waveform Capture.
Conclusion
Loose neutrals may present a wide range of symptoms, especially if said symptoms are intermittent. Correctly diagnosing a loose neutral takes time, but is important to resolve given the possible impact on equipment in the affected circuits. A Guardian and PQ Canvass can help identify the problem and put you on the right path to repair the root cause instead of just treating the symptoms.
