Abstract
One of the most useful methods for examining specific power quality activity is through filtered predesignated reports. At PMI we’ve achieved this with our “Significant Change Report.” The primary use of this report is in data collection during quick fluctuations in the line voltage, with a single cycle response, but filtering out gradual changes. The report provides a quick way to gauge the voltage quality. It does this by concentrating and recording only on voltage fluctuations that exceed pre-established thresholds.
The Significant Change Report is found in our ProVision software. The report and accompanying graph allows the user to collect only substantial voltage changes with single-cycle sensitivity, but without wasting memory recording continuous, stable steady-state readings. The Significant Change Report operates on the principle of user-configurable, pre-established set points that trigger the recording once the preset threshold is exceeded.
The Significant Change Report uses trigger logic based on a user-determined voltage threshold. During the recording session, at the end of each second, the highest and lowest RMS voltage for that second is compared with the “standard” significant change voltage. During the two minute countdown, the “standard” is measured, integrated, averaged and picked. For example, on a 120 volt line the voltage measured for the standard might be 121.8 volts. The normal default voltage threshold parameter is 3 volts.
NOTE: The range of adjustment available for this threshold voltage depends on what version of the software is being run.
For a recording to be triggered, if the threshold is at the default of 3 volts, and the standard has been determined to be 121.8, the Significant Change Report would be triggered with a RMS voltage swing of anything greater than 3 volts. In this scenario, the trigger voltage would have to be greater than 121.8 plus 3 volts (124.8 volts) or lower than 121.8 minus 3 volts (118.8 volts) for a one second interval.
During a one-second interval, only one Significant Change can be recorded per channel. If maximum voltage and minimum voltage both meet the threshold in the same second, the voltage with the largest deviation from the previous standard is picked for the new standard. It is important to note that the “standard” value does change every time a significant change event is triggered. When the recorder is triggered due to a Significant Change, the exact trigger voltage is recorded along with the date and a timestamp to the second along with the channel number.
After the Significant Change Report has been activated, even though the same trigger level is used for all channels, data is recorded for all available channels simultaneously. All voltage input channels share the same memory for Significant change. If this memory would happen to become completely full, then the Significant Change recording would stop recording. Depending on the scanner, the amount of memory allocated for the Significant Change function varies, but every scanner can record hundreds of records; most scanners can record over one thousand records. The majority of PMI’s scanners, the Significant Change function is always enabled; however some of the vintage Scanners disable the Significant Change function when the Flicker recordings are enabled. This is true for the following scanners: the VP-1, and the 300 Volt Scanners, the VS-3, VS-1, VS-1M, iVS-3, iVS-1, and the iVS-1M, with serial numbers below 6000.
Example
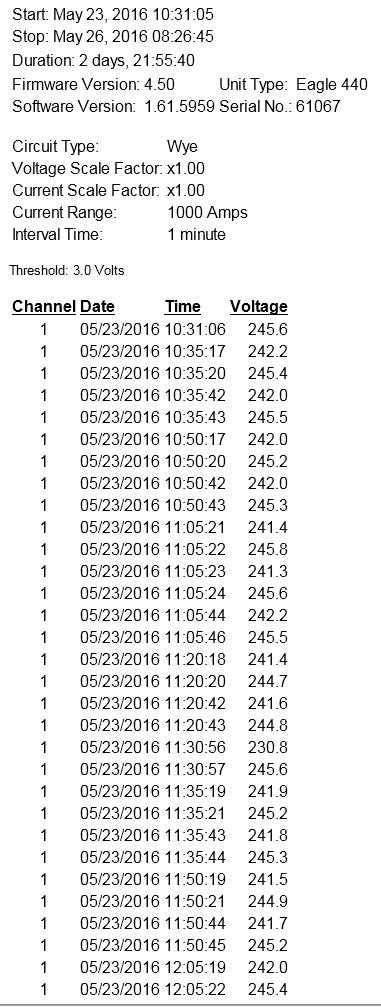
Figure 1, above shows a screen capture of a typical Significant Change Graph; Table 1 shows report data. Figure 1 shows a graph of the significant change “standard” for each channel, which changes each time a significant change event is triggered. The voltages displayed are not necessarily the actual measured voltage, but the measured voltage must be within the significant change threshold of the “standard” value, or a new significant change event would trigger.
Each voltage change in the graph corresponds to a new significant change event. Another advantage of the significant change graph is that it has a one-second resolution, regardless of what the regular strip chart interval was. Often, this is a way to get a more fine-grained look at the voltage in a recording where the strip chart interval was much longer, for example one minute or more (Channels 2 and 3 were removed from the report due to the length).
Summary
- The primary use of this report is in data collection during quick fluctuations in the line voltage, with a single cycle response without recording gradual changes reducing the amount of data recorded, thus the amount of memory used for a given amount of time.
- A key advantage of the Significant Change report is that only one disturbance per channel can be triggered each second. If multiple disturbances occur during a second, only the largest one is recorded. This limits the size of the report, making it much easier to analyze, while still giving single-cycle response.
- This report offers a quick way to gauge the voltage power quality due to the fact that only the voltage fluctuations that exceed the pre-established thresholds are recorded.
- The pre-established threshold default is 3 volts; however this can be modified by the user from as small as 1 volt to as large as 8 volts, and higher on some Scanner models.
- Depending on the nominal voltage, a threshold value of between 2 and 5 volts is normally the most useful range for collecting meaningful data of a voltage disturbance.
- The Significant Change report is the most useful report for determining how often and to what degree the line voltage is fluctuating. If there is no Significant Change record, this indicates there were no fluctuations greater than the threshold. It is important to note that the “standard” value does change every time a significant change event is triggered.
- A stripchart can be correlated with Significant Change record by using the timestamp. The timestamp can be used to find the same time period in the stripchart to find out what the voltage and current were before and after the disturbance, giving some indication of the cause of the disturbance.
- It is important to note that the “standard” value does change every time a significant change event is triggered.
