Abstract
Daily Profiles are used to spot daily trends in voltage, current, power factor, etc. An entire recording session is combined to form the “average” 24-hour day, which is then plotted on a graph like a stripchart. Power quality issues are usually not addressed with Daily Profiles (except perhaps consistently low or high line voltage or harmonic distortion). Rather, average line conditions such as regulation voltage, load current, etc. are profiled. This paper explains daily profiles and their uses, as well as how to create a daily profile graph in Provision.
The Daily Profile graph is one of several different graph types available with ProVision, PMI’s free power quality analysis software. Provision allows you to create ten different types of daily profile graphs: RMS Voltage, RMS Current, Voltage THD, Current THD, Real Power (Watts), Apparent Power (VA), Reactive Power (VAR), Phase Angle, Power Factor, and Displacement Power Factor.
What a Daily Profile Records
Each measured quantity has only one Daily Profile per channel in a recording session; there are four voltage Daily Profiles in a recording session, one per channel. The profile is averaged over the entire recording session. This average is created by dividing the 24-hour day into 96 time periods, each 15 minutes long. During each 15 minute period, the recorder computes the average value for each profile (voltage, current, etc.). This 15 minute average is then averaged with all the previous days’ averages of that 15 minute period. For example, the first Voltage Daily Profile data point is the average voltage during the 15 minute period from 12:00am to 12:15am, averaged again over the entire recording time. If the recording lasts a week, then this 12:00-12:15am period is averaged seven times over the entire week.
There are no settings for daily profiles. All available daily profiles in a recorder are always enabled, regardless of the settings for any other record types. Memory does not run out for a daily profile; it just keeps averaging as long as the recording session lasts (there is a practical limit of about a year). Some Scanners record just a voltage Profile, others voltage and current. The ViP Scanner records a Profile for voltage, current, real, reactive and apparent power, power factor, displacement power factor, voltage and current THD, and phase angle.
Uses of Daily Profiles
Daily Profiles are typically used to profile or characterize a parameter, such as average load current or power factor. Since the profile is supposed to reflect average line conditions, the more loads included in the recording, the better the average. Monitoring a single small load such as a small office building would not create a very good profile of distribution line conditions (such as distribution line power factor), since the building would be a small part of the total distribution load. Voltage is somewhat of an exception in that anywhere can be good place to create a profile: every other load (at least those nearby) will see the same distribution line voltage. The ideal location for creating power factor profiles is where a PFC would be placed to correct power factor.
The Voltage Daily Profile is normally used to identify voltage regulation problems, or other steady-state low/high voltage issues. The current profile can be used to identify daily trends in load current. This is also possible with the Apparent Power Profile. Power factor and reactive power profiles can be used to set PFC timers to correct for power factor only when necessary during the day. The voltage and current THD Profiles show when harmonic distortion is present during the day.
The more days the recorder records, the better the average created by the profile. A recording session that just lasts a single day doesn’t incorporate any daily averaging at all. Since a profile starts with all zeros, a recording session that doesn’t last 24 hours will include some 15 minute blocks with the data still zeroed. A recording session that doesn’t even last 15 minutes will have all zeroes for its Daily Profile.
A stripchart can also be used for profiling tasks, but is not ideal. The stripchart interval is usually set to an interval faster than 15 minutes; a fast interval can show too much information, making it hard to form a good average profile. Often the stripchart only has enough memory for a week or two, limiting the averaging time; the Daily Profiles have no such limit. Most importantly, the stripchart does not divide the data into an averaged day period, so it can difficult to spot daily trends in the graph.
Daily Profile Graph Types
RMS Voltage – RMS voltage is the value when the Root Mean Square is taken of a set of voltage points. RMS is the statistical measure of the magnitude of a set of recorded voltage points.
RMS Current – An RMS Current Daily Profile graph is created by applying the same formula on a set of current points as applied to the RMS Voltage graph.
Voltage and Current THD (Total Harmonic Distortion) – Total Harmonic Distortion is the measurement of the distortion in an electrical signal caused by the non-fundamental frequencies. THD is calculated by adding all frequencies present in a signal, subtracting the fundamental frequency, and the dividing the total by the fundamental frequency. An electrical signal with no harmonic distortion present would appear as a pure sine wave.
Real Power and Reactive Power – The Real Power graph shows the net transfer of power in one direction averaged over several cycles. The Reactive Power graph shows power flow that goes to and from the utility without doing any work.
Displacement Power Factor – Displacement Power Factor is calculated by taking the cosine of the phase angle of a reading.
Apparent Power – Apparent power is the quantity extrapolated from the following formula: (Apparent Power)2 = (Real Power)2 + (Reactive Power)2.
Phase Angle – Phase angle is calculated by taking the difference between the voltage and current 60Hz phase angles. The angle is between -180 and 180 degrees, where zero degrees indicates that the voltage and current are exactly in phase.
Opening a Daily Profile Graph in ProVision
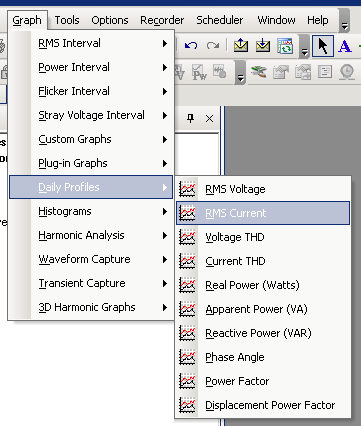
In Provision, select “File” and “Open”, or press CTRL+O. Browse to the recording file to be opened. Once the file has been opened, expand the Projects folder and then the Temporary folders in the Explorer panel. Check the checkbox next to the file you just opened. On the main toolbar, select Graph and then Daily Profile (Figure 1).
In Figure 2, a voltage daily profile graph is shown. Each plot is a voltage channel, with the average for each 15 minute period of the day plotted. The x-axis ranges from midnight (hour 0) to just before midnight at the end of the 24 hour period (hour 23.75). Here the three line voltages vary from a max of 275V during the night to a min of 264V around 4pm. Most of the low voltage period is between 8am and 7pm, although the transition is fairly slow. This a 4% variation from night to day at this location.
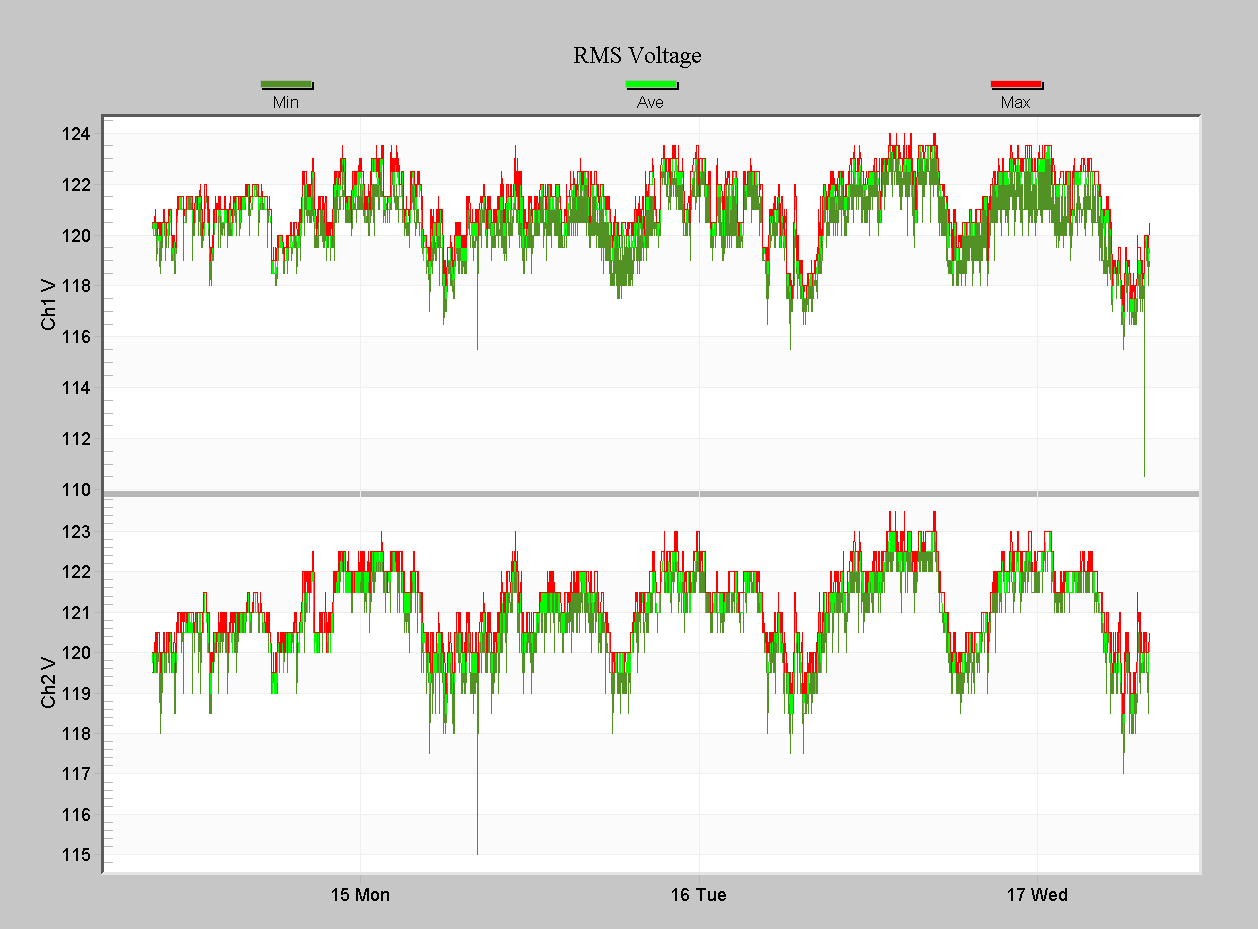
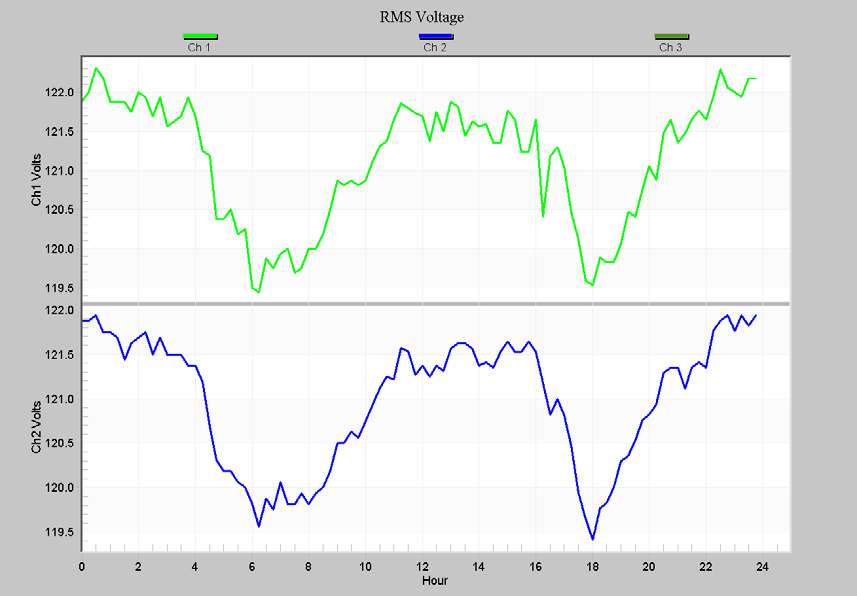
Figure 3 shows a portion of the RMS Voltage stripchart for a long recording, and Figure 4 is the corresponding Volt Daily Profile graph for a single phase residential location. Although a regular daily variation is visible in the stripchart, the pattern is much clearer in the Daily Profile. Here the voltage dips twice each day – once form around 5am to 9am, and again from 5pm to 9pm. The lowest spots are 6:30am and 6pm – likely a morning routine and dinner time. The absolute voltage change is just 2.5%, but this is a very common residential pattern, and often aggregates over entire neighborhoods to form more severe voltage excursions.
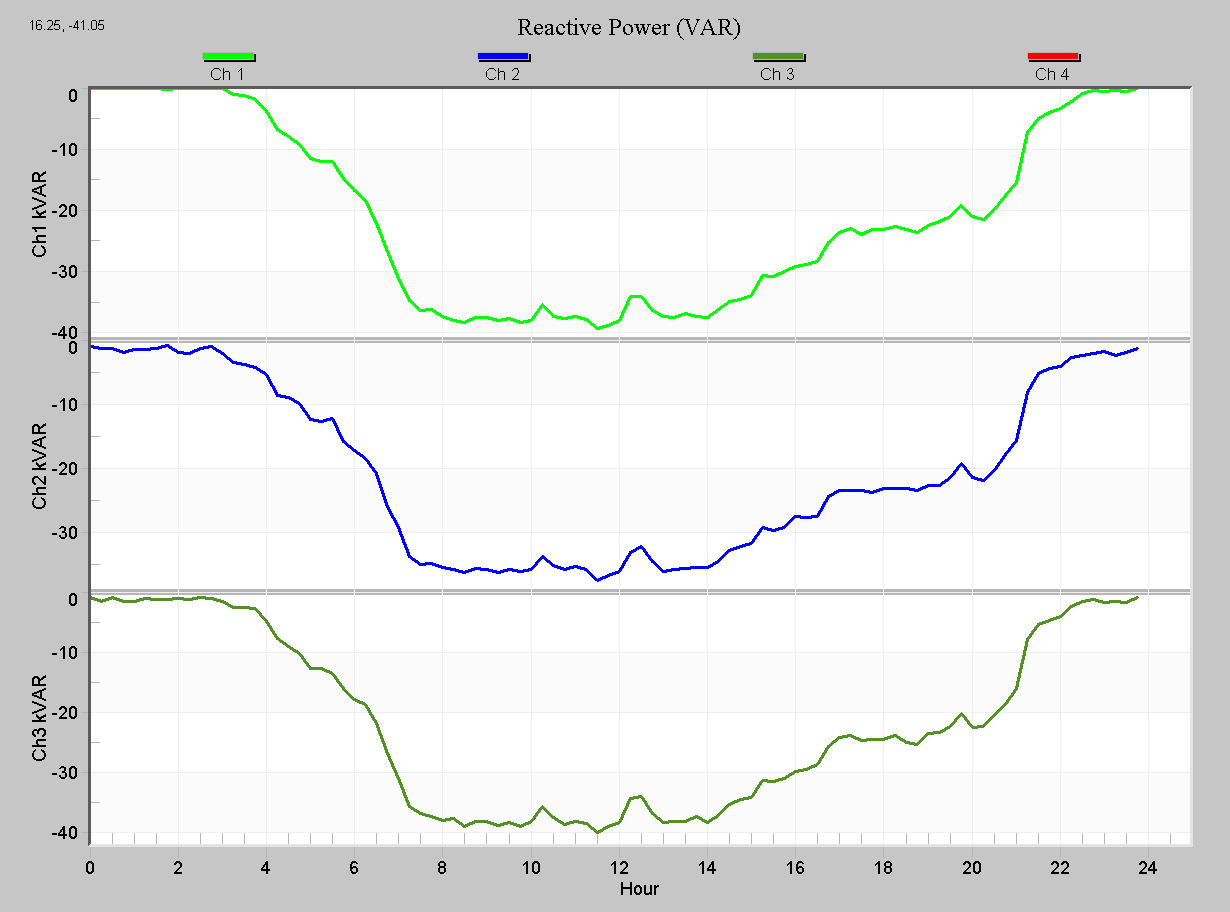
In Figure 5, the reactive power (kVAR) daily profile is shown. A negative reactive power here indicates a lagging power factor, and the kVAR value shown is the amount of inductive reactive power flowing. A corresponding power factor correction capacitor (PFC) can be used to restore a unity power factor. The time of the VAR change may be used to help configure timer-based PFCs. In this case, most of the PFC correction is needed between 7am and 4pm.
Conclusion
Like the cycle histograms, Daily Profiles are especially useful because they’re always recorded, cover all the basic RMS and power measurements, and don’t run out of memory. Even if the corresponding stripchart was not enabled, daily profiles can be relied on to give a basic overview of RMS or power quantities, and THD.
