Abstract
Flicker is still one of the top PQ complaints reported to utilities, therefore it is important to be able to effectively quantify and evaluate these types of problems. In many situations it can be beneficial to customize the flicker curve to meet the needs of the individual situation or to existing “house” standards already developed and in use by the utility. The flicker monitor available on PMI recorders has settings that allow the default IEEE Standard 141 (GE Flicker curve) to be customized based on a user specified settings. This paper will help users understand the steps necessary to change the default flicker curve settings and the situations in which this need might arise.
Flicker Perception and Causes
Flicker can be defined as the visible fluctuation in light intensity due to variations in the supply voltage. This definition has two main parts where the change in the voltage, over a given period of time, cause variations light intensity that are perceivable from the standpoint of the observer. Although the definition of flicker is driven by a perceived light change, the method of measuring this problem is a calculation based on supply voltage variation, given a known relationship between voltage changes and incandescent light output.
Flicker is caused by voltage modulations in the distribution power where the lighting source is not capable of maintaining a steady intensity in the presence of the voltage variations. A change in voltage causes a more than linear change in light intensity, with the result that even small voltage fluctuations can cause a perceptible change. Frequent changes are also more noticeable for a given voltage deviation. Typically voltage modulations are created by nearby high-current loads that are switched off and on, lowering and then increasing the delivered voltage. A high system impedance (undersized transformer or wiring, poor connections, etc.) increases the amount of voltage drop, and thus flicker.
Ultimately, flicker is based on perceptions and is dependent upon the physiological sensitivities of the individual. The point at which flicker is perceivable or becomes irritating varies for each person and depends on many factors (see Application of the GE Flicker Curve). It is helpful to keep this in mind to help guide you in adjusting the flicker curve to meet your needs.
What Is the GE Flicker Curve
The GE Flicker Curve was developed to serve as a guideline for assessing flicker. To create the curve researchers studied the human responses to light fluctuations at varying depths and frequencies. Participants in the study were asked to indicate their recognition of flicker at two different levels: the point at which they were able to perceive it and again at the point where it became irritating. Based on their responses the two thresholds were created [1]. The results were averaged and plotted to resulting in the familiar curve published in the IEEE Standard 141 (Figure 1).
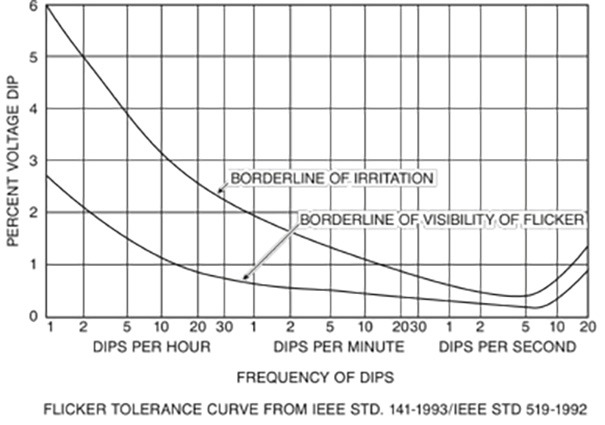
There are several features of the flicker curve that we should take note of. The Y axis represents the percent of voltage dip from the nominal in a range of 0% to 6%. The X axis represents the frequency of dips per hour, minute, and second. The two traces on the graph represent the level of perceptibility. The “Borderline of Visibility of Flicker” is the point at which flicker is visible to most people. The “Borderline of Irritation” curve represents the point at which deeper psychological impact is taking place, and a person is likely to become irritated by the light flicker.
The IEEE Std. 141 flicker measurement technique used rectangular modulation of the AC voltage waveform to establish the two standard curves. The newer IEEE 1453 flicker standard uses a completely different algorithm to quantify flicker. Although the 1453 method is more encompassing, handling arbitrary modulation types from multiple sources, the original method is still useful. One big advantage is the ability to define a custom flicker curve, which may be more or less sensitive than the ones in the standard.
Reasons to Define a New Curve
There are several reasons that a custom threshold curve might need to be defined:
- To provide a higher/lower standard for specific customers based on their need.
- Utilities can develop their own curve based upon the perceptibility of customers in a region. For example, if the customers are known to be less perceptible then a custom curve can be created. This may be the case in industrial areas, without significant incandescent lighting.
- Defining a new curve to mask known equipment that is causing flicker but is not a problem to the customers at the location. This would allow the flicker meter to report only events outside of the known, acceptable level.
- To set baseline curve in a region that historically has had no flicker complaints, but where the existing flicker may be above the standard curves.
GE Flicker Curve Default Settings
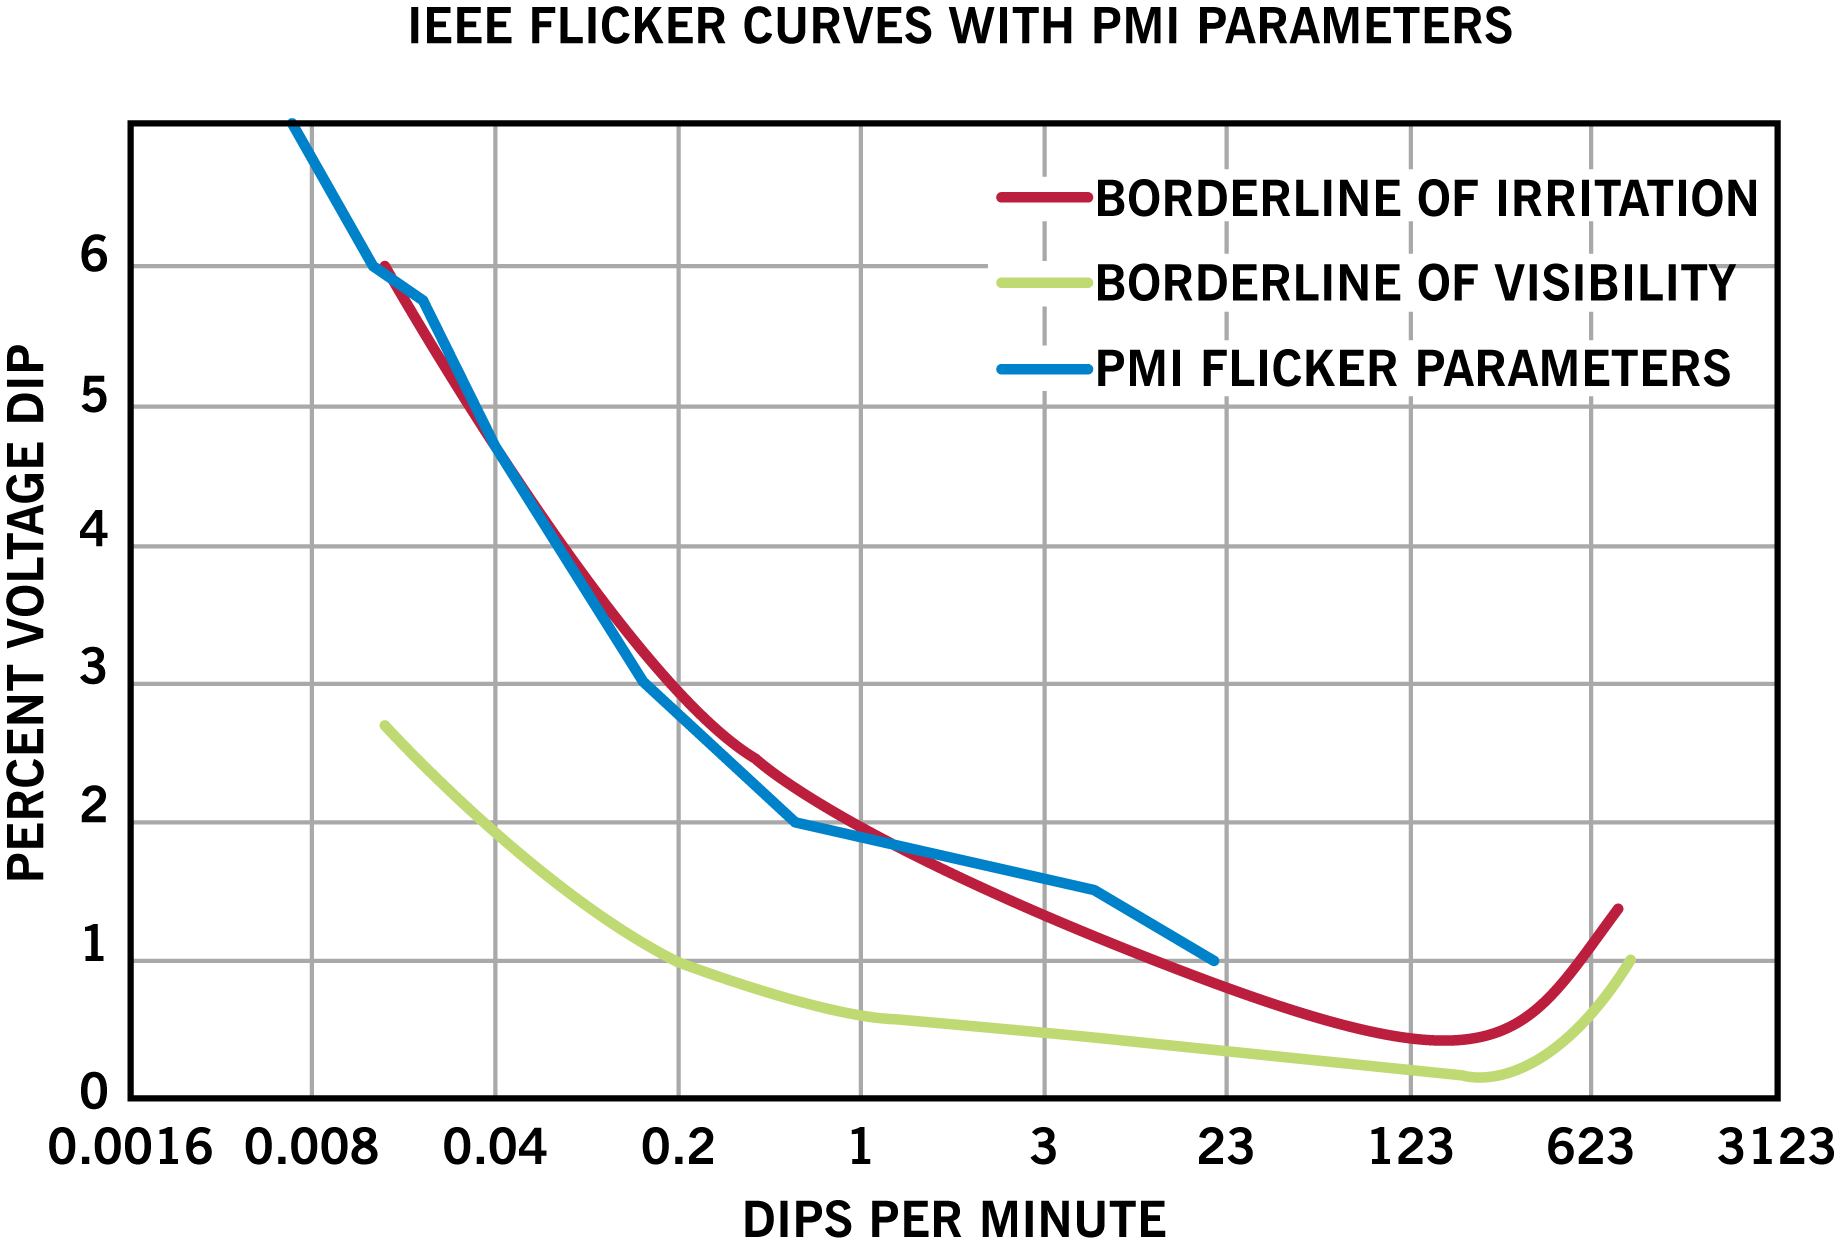
The default settings for the IEEE Std. 141 Flicker curve in PMI’s recorders are based on the “Borderline of Irritation” threshold. Figure 2 shows the default PMI flicker parameters plotted along with the IEEE STD. 141 curves. In the next steps we will demonstrate how these settings are derived to increase our understanding of the customizable values.
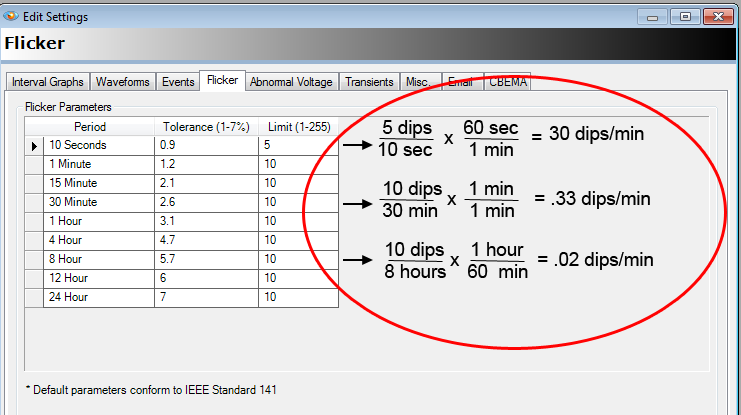
The flicker settings are available in ProVision by clicking on “Advanced Settings” from the Edit Settings window. Use the “Flicker” tab to reveal the flicker parameters. There are 3 parameters for each point that are necessary for establishing a flicker threshold. The Period column specifies the duration of time over which the recorder will use to keep a count. The values in this column are not customizable. The Tolerance column indicates the voltage dip that will increment the count. These values can be customized and accept values in the range of 1-7% in increments of 0.1. The Limit column specifies the dip count that is acceptable for the particular tolerance over the given time period and is customizable from 1-255 in integer increments.
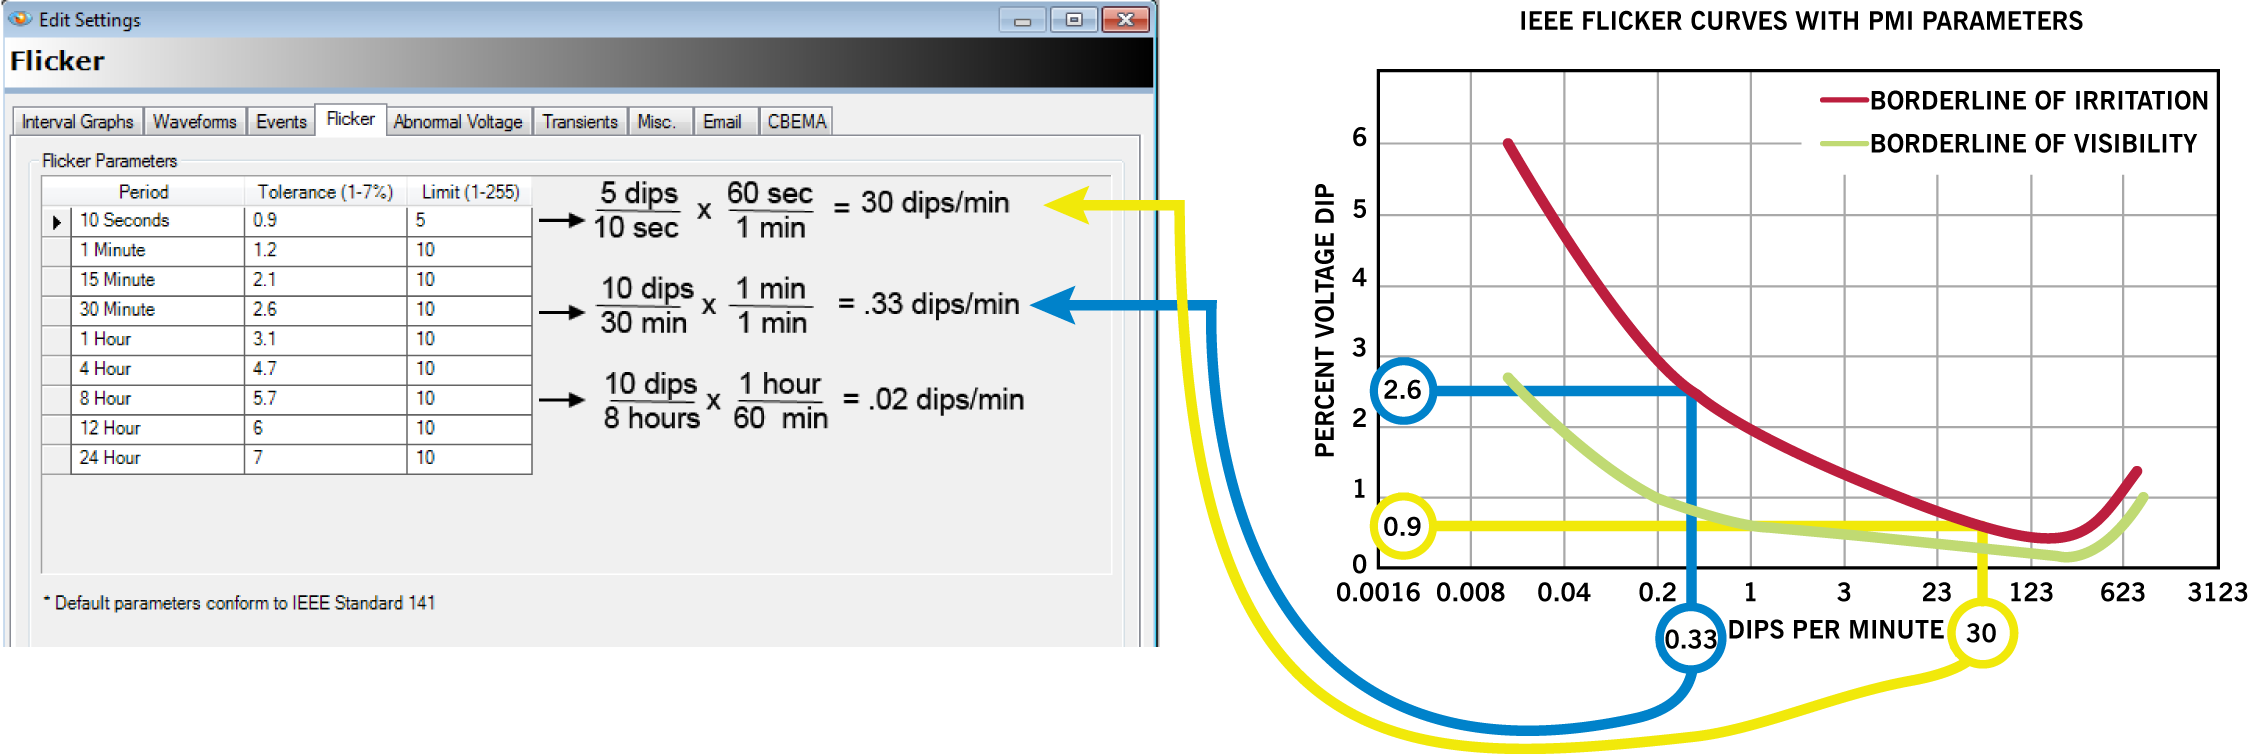
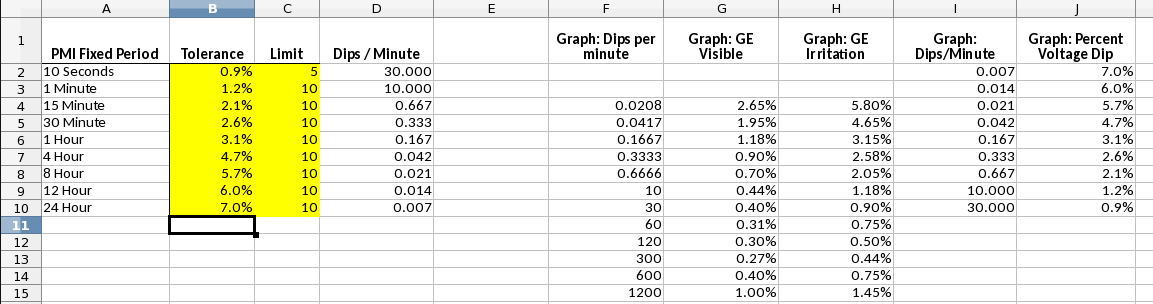
Plotting the existing settings to the graph requires a few calculations to be made as seen in Figure 3. For each row, the limit setting (in dips) needs to be multiplied by the time period to obtain the Dips Per Minute (DPM). The DPM is then used to plot the tolerance (percent voltage dip) on the Y axis. Using row one as an example, there is a limit of 5 dips per 10 second period resulting in a 30 DPM rate. Figure 4 demonstrates how to plot the given tolerances using the calculated DPM rates.
How to Define New Flicker Parameters
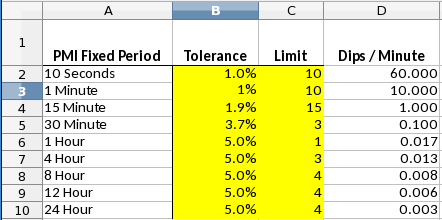
To define a new set of threshold settings for your PMI recorder, an existing data set can be mapped to the predefined periods in the flicker settings panel. For an example of this we will use existing tabular data to create custom flicker settings from the “Revised PP&L” sheet seen in Figure 6.
To assist in matching tabular data to the flicker settings please download the spreadsheet available here to help with the process. This spreadsheet allows the adjustment of the tolerance and limit values (indicated in yellow), provides a visualization of the curve, and can assist in finding the proper limit values by automatically calculating the DPM (See Figure 5).
![Figure 6. In house flicker table [1] with added dips per minute calculations](https://powermonitors.com/wp-content/uploads/WP218-figure-6.png)
First, Find the DPM Rate
Using the table in Figure 6, calculate the Limit / Period with the information provided. Since the table contains entries in hours, minutes, and seconds; make sure to use the proper conversion factors to match the time period to the x axis of the graph that is being mapped to.
Second, Calculate Limits
The spreadsheet can now be used to help find acceptable limit values using the DPM calculated in the previous step. Starting with the smallest time interval found in the previous step adjust the Limit values to match the DPM values calculated in the previous step (Figure 7).
For this example some additional spacing was added to the end of the graph because the data source didn’t have enough points to cover the preset time span in the settings. In this case you should add limits that are greater than the last valid entry to prevent false triggering of the flicker meter.
Third, Enter in the Tolerance Values from the Table
Transfer the existing tolerance values into the spreadsheet to view the resulting curve. Make any changes to suit your needs.
Fourth, Copy the Tolerance and Limit Values to ProVision
These values can then be copied into their corresponding locations in the settings panel. The settings can then be saved to the recorder.
Further Customizations
There are times when it may be desirable to exclude a known piece of equipment that is causing flicker in order to use the flicker event capture to illuminate more interesting information. This is especially true if the flicker caused by that equipment is not irritating to the surrounding customers.
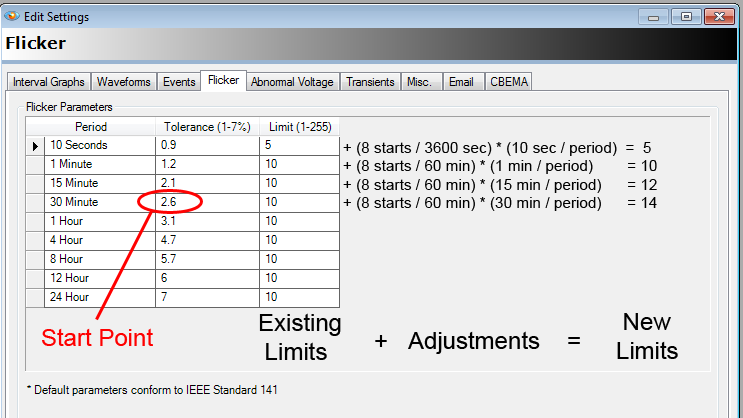
To exclude a known flicker source, the limit for a particular threshold must be adjusted along with all of the time periods less than the threshold. For example, consider a motor that causes a 2.8% voltage drop and it is known to start 8 times per hour. To exclude it, find the time tolerance that is one step lower (in value) than the row that exceeds the motor start threshold, this is marked as the “Start Point” in Figure 8. Calculate how many times it will exceed the tolerance during the given time period and increase the limit by the amount. Round as necessary to obtain the desired result. Repeat this process for all periods shorter than the exclusion point.
Conclusion
PMI recorders have the capability to use custom flicker curve settings to capture flicker events. By following a few conversion steps, the internal settings can be plotted on a curve to view the existing settings. Additionally, we showed how to convert tabular flicker data into tolerance and limit values that can be saved to the recorder. With customized flicker curve settings, PMI recorders can be used to help deliver quality power that meets the standards of your organization.
References
- Voltage Fluctuation and Lamp Flicker Establishment Of Guidelines, Pennsylvania Power & Light December 1994
