Abstract
PQ Canvass is Power Monitors Inc.’s newest iteration of web-based power quality analysis software. It builds on the foundation established by Canvass and adds many new features, including variable-interval stripcharts; live waveform, harmonic and vector graphs; recorded waveform capture analysis; recorded harmonic analysis; and direct support for the new Cell Guardian.
One of the key features of both Canvass and PQ Canvass is exception-based triggered alerts. This white paper is going to discuss how to configure a PQ Canvass alert distribution list for different trigger criteria and with different alert destinations (SMS messaging and email).
PQ Canvass
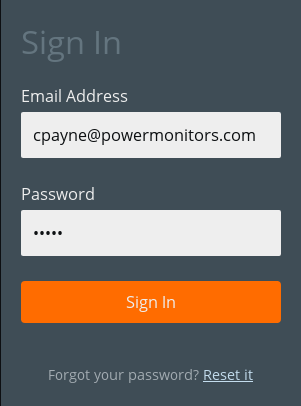
The PQ Canvass web application is located at https://pqcanvass.powermonitors.com/ and requires pre-registration with PMI for an account. Once a user has procured an account, simply sign in with the new credentials to see the home screen. See Figure 1 for an example.
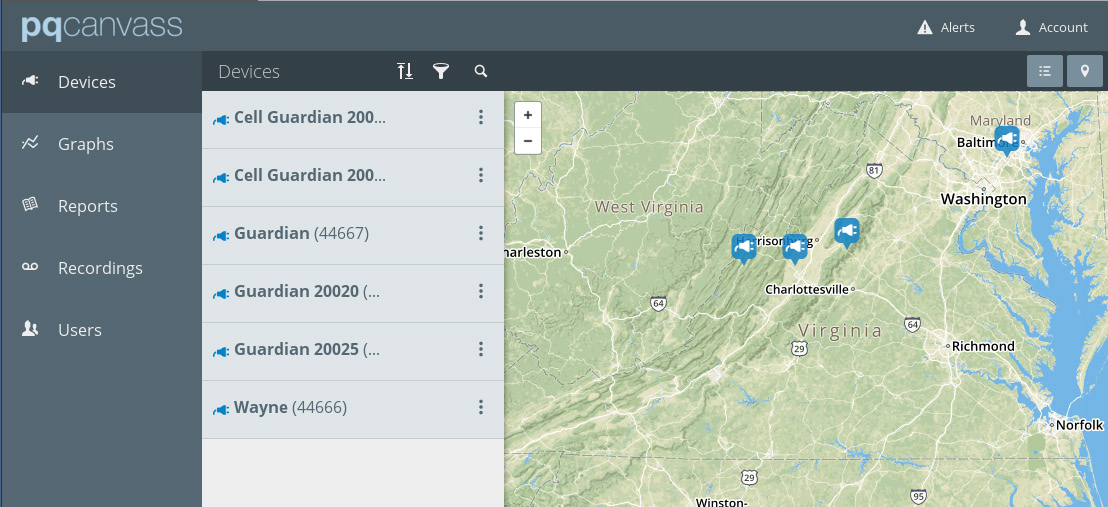
Once the user has signed in, they are presented with the “Home View”, which defaults to showing a map with the user’s PQ Canvass-enabled devices geolocated to their respective positions and a list of all visible devices. See Figure 2.
Configuring a Notification List
The next step is to actually configure the distribution list for the devices, alerts, events and users to be notified.
To begin, select the Account menu in the upper right-hand corner of the screen. See Figure 3. Next select the “Settings” menu item. This will bring up the “Account Settings” menu. From this menu, select the “Notifications” item, which will then bring up the “Notification Lists.” In this example, the author has already created a handful of “test” lists for demonstration purposes. When the user first enters this screen, the list should be empty.
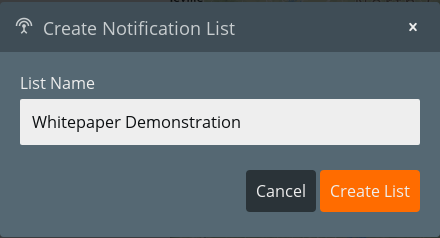
All notifications are configured based on a “List” – which is what will now be created. Start by clicking on the “+ Add List” button at the bottom left side of the Notification Lists window. This will present the user with the “Create Notification List” dialog, as shown in Figure 4. For the purposes of this demonstration, the author has chosen “Whitepaper Demonstration” as the notification list. The user, however, should select a name that is reflective of what the list will be used for, such as: “Voltage Sags at XYZ Corp.”
The name of the newly created list should now be visible in the “Notification Lists” window. Note the list should report 0 Users, 0 Devices, 0 Alerts and 0 Events as being configured for the list. That is the next step in the process.
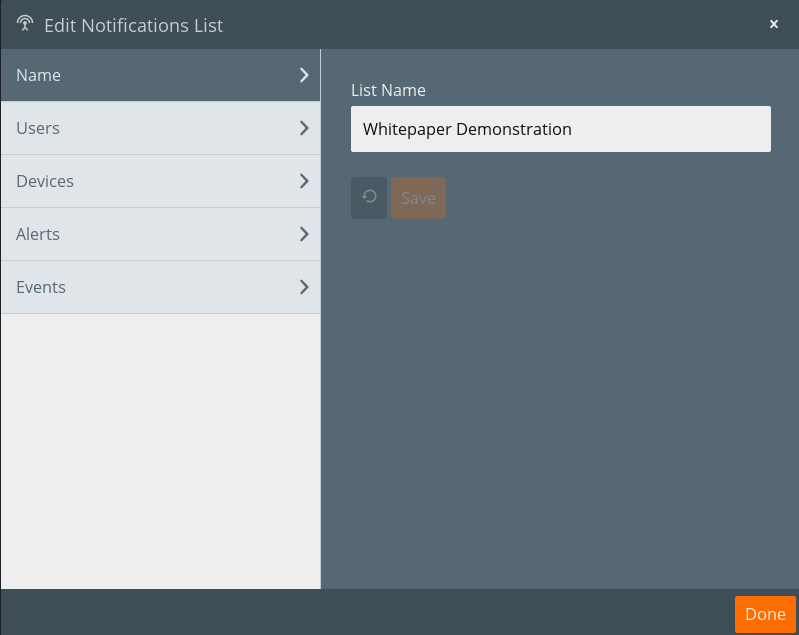
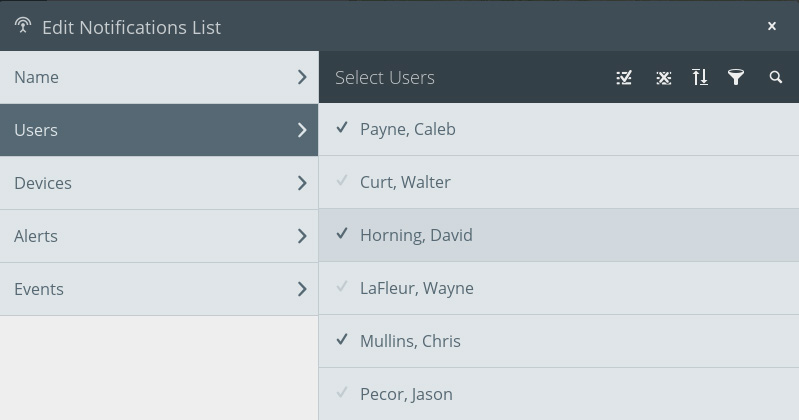
Begin by selecting the pencil icon to the right of the Notification List that was just created. This transitions the user into the “Edit Notification List” window (Figure 5). Each of the tabs along the left side of this window (Name, Users, Devices, Alerts and Events) are configurable elements in the Notification List.
Name Tab
The Name Tab allows the user to rename the Notification List. Perhaps the list name was non-descriptive or mislabeled – the name can easily be adjusted by typing in a new value in the “List Name” field in the right panel of the window and clicking “Done” to save changes.
Users Tab
The Users Tab is used to select which users will be notified of events for this particular Notification List. To select a user, simply click on their name and the checkbox next to the name will be highlighted, as shown in Figure 6.
Devices Tab
The Devices Tab is where a user will select which devices are to be monitored for the Notification List. Similar to how users were selected above in the Users Tab section, devices are enabled for the Notification List simply by clicking on its entry in the list. As with users, the checkbox next to the device will be highlighted when successfully selected.
Note: If no devices are selected, no alerts will be generated for the Notification List.
Alerts Tab
Alerts in PQ Canvass are used to signify a measured parameter exceeding a threshold. For example, high and low limits may be set on RMS voltage, current, or power. If a measurement crosses a threshold, an alert is generated in the Guardian and sent to PQ Canvass for processing.
The Alerts Tab is used to specify which alerts will trigger an SMS or email notification. The way it works is that for each alert selected, any device that triggers on that alert will generate an email or SMS message to each of the users selected in the Users tab.
Events Tab
Events in PQ Canvass are used to signify either power quality-triggered events such as waveform capture, flicker, or significant change. The events may also be generated by device operations such as recording, restart, power outage or restoration, etc.
The Events Tab is used to specify which events will trigger an SMS or email notification, just as was the case with alerts. And, similar to alerts, each user that has been selected will receive an email and/or SMS message for each device in the selected devices tab that triggers for any of the selected events.
Once the user has configured the Users, Devices, Alerts and Events for the Notification List, simply click the “Done” button on the bottom right-hand side of the window to save changes.
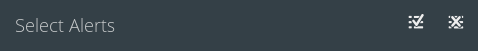
Tip: If the user wishes to select all of the elements in a selection list (i.e. all users, all devices, all alerts, etc.) there is a button to the top and right of the selection list to enable this (Figure 7). The button to the left, which is an icon image of a list with a check mark over it, selects all of the elements in the list. The button to the right, the image icon with the list items and a superimposed “X” will deselect all of the elements in the list. This can be useful when setting devices to trigger on all alerts and events, etc.
Configuring SMS Numbers and Email Addresses
SMS phone numbers and email addresses are configured on a user-by-user basis. Each user is able to add phone numbers and email addresses to their profile and then to select whether or not to receive notifications at any of the given contact entries.
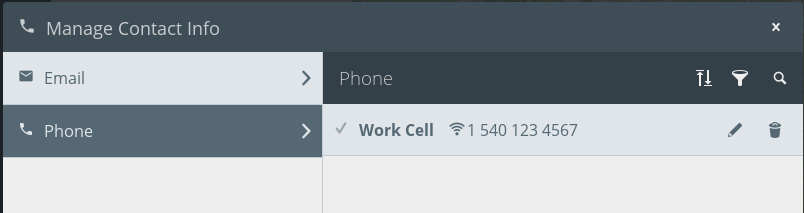
To add a phone number and enable SMS notifications on it, start by clicking on the “Account” Menu and then select “Account Settings” menu item. Next, click on the “Contact” button to display the “Manage Contact Info” window (Figure 8).
From the “Manage Contact Info” screen the user will see two tabs on the left: “Email” and “Phone.” Click on the corresponding tab to add an equivalent entry.
For demonstration purposes, let us add a new phone number on which SMS messaging will be enabled for alerts. Start by clicking on the “Phone” tab to bring up the available phone entries. The list on the right should be empty at this point.
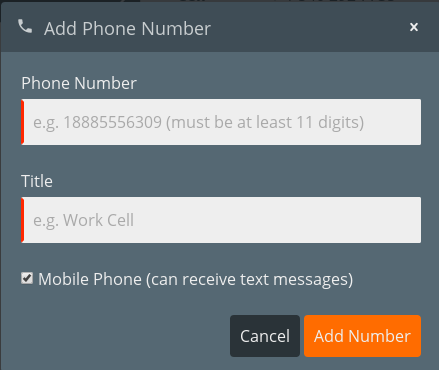
Next, click on the “+” icon at the bottom right hand side of the Phone number list pane. This will present the user with the “Add Phone Number” dialog, as shown in Figure 9. Enter the phone number and then give it a “Title” (a name to reference it by, such as “Work Cell” or “Personal Cell”, etc.). Next, if the phone is a cellular phone, select the “Mobile Phone” check box at the bottom of the dialog. Note that selecting this check box does not mean that SMS messages will be delivered from notification lists to this device – it simply means that it is eligible if the user so desires.
Now that the phone number has been added the new entry should show up on the right-hand side of the “Manage Contact Info” dialog (Figure 10). Note that the checkbox to the left of the new number is not selected. This means that the device will not be used for notifications (if the user has been added to a Notification List). To enable notifications on the entry, simply click the checkbox to highlight it.
When the user has finished adding email addresses and phone numbers, click on the “Done” button at the bottom right of the window to save all changes.
Setting Trigger Thresholds in a Device
Now that the Notification List has been created and the user has created contact entries at which they wish to receive their notifications, it is time to configure the device’s trigger thresholds so that it can generate notifications for the user.
Start by selecting the device whose thresholds are to be set. This can be done by clicking on its icon on the map or by select the three vertical dots next to its entry in the device list. If the user has clicked on the map icon, then a menu of three buttons is presented in a dialog: information, graph and center on map. Click on the information icon. If, however, the user has selected the three dots on the device list, then a slightly different set of menu items is presented: graph, report, information and locate. Again, click on the information button.
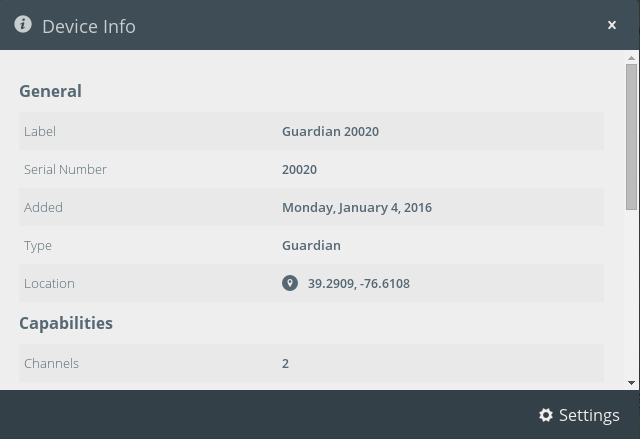
The Device Info window should now be visible (Figure 11). This window provides a series of information about the device itself, such as the user-defined label, serial number, when it was added to the system, what type of device it is and its geolocational information.
To set up the trigger thresholds, click on the “Settings” button at the bottom right of the “Device Info” window. The “Device Settings” window is now visible and has a series of tabs on the left: “General”, “Location”, “Recording” and “Notifications.” For the purposes of this whitepaper, we will jump directly to the “Notifications” tab, as shown in Figure 12.
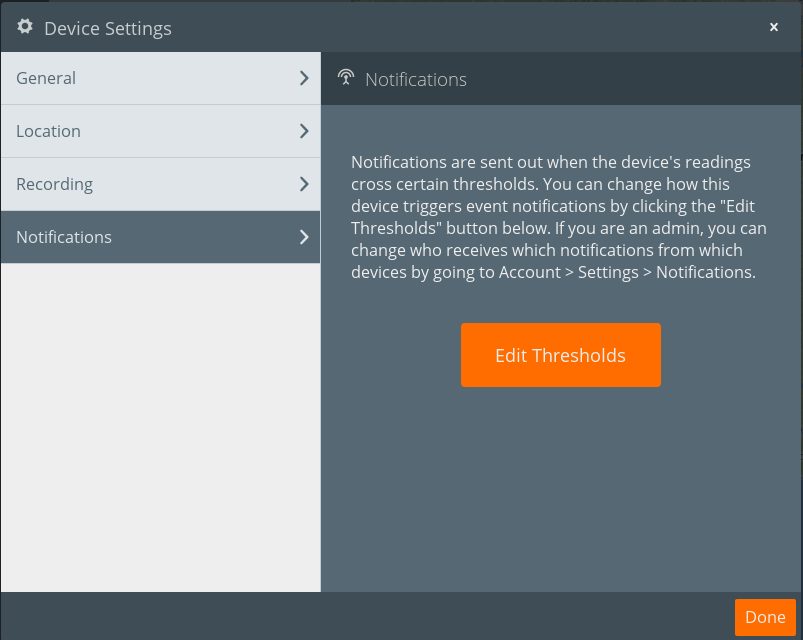
The user will likely note the giant orange button that reads: “Edit Thresholds.” Push the large orange button. At this point, the web application triggers a series of network communications to retrieve the thresholds that are presently configured from the device (note that users can also set trigger thresholds with the Network Management Software (NMS application)). Retrieving the thresholds directly from the device prevents any mangling that would occur were someone to configure them from the NMS instead of directly from the PQ Canvass application.
Once the “Edit Thresholds” button has been clicked, it may take a moment for the application to retrieve the settings from the device in the field. Once the connection has been established and the values have been retrieved, they are displayed in the “Edit Thresholds” window (Figure 13).
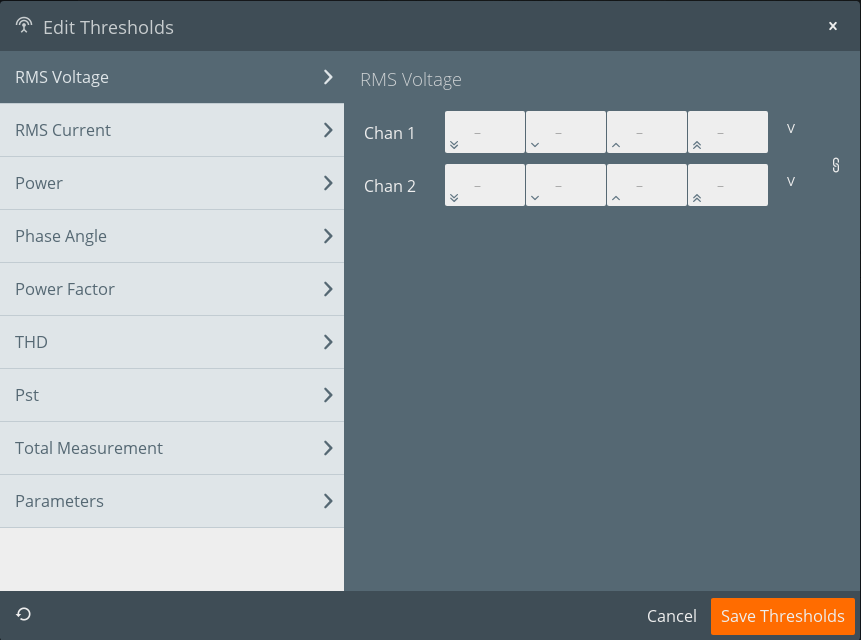
This window has several tabs, essentially one per configurable measure: RMS Voltage, RMS Current, Power, Phase Angle, Power Factor, THD and Pst. The final two tabs, Total Measurement and Parameters, are special cases. The Total Measurement tab is for cumulative totals, such as Total Real Power, Total Reactive Power, Total Apparent Power, etc. The Parameters tab allows the user to specify global trigger thresholds, such as the holdoff time, hysteresis and averaging window.
Each measure tab has a series of rows corresponding to the number of channels that the device can trigger on. Our example uses a Cell Guardian, which has two channels of voltage and current, so the RMS Voltage tab shows two rows, as shown in Figure 13. If no thresholds had previously been programmed for the device, the fields will be empty (“-”).
Note that there are four boxes on each row. These correspond to low low, low, high and high high thresholds, from left to right. Each box contains a small icon to help with identifying which threshold is being set: two down arrows is for low low, a single down arrow is for low, a single up arrow is for high and a double up arrow is for high high.
Tip: To the right of the channel rows is a chain link icon button. If this button is clicked it will ensure that all channels are linked to the channel 1 thresholds. This saves time if configuring a multiple channel device to use the same thresholds across all channels.
The user should cycle through each tab setting the trigger thresholds to the desired levels. Once complete, simply click on the “Save Thresholds” button and wait as the application re-connects to the device in order to send the thresholds.
Conclusion
PQ Canvass expands greatly on the original Canvass application. Power Quality alerting has been added, and capabilities have been expanded to add contact configuration allowing multiple email addresses and SMS phone numbers. The highly configurable threshold settings provide a mechanism for fine-grained near-real-time alerting through email, SMS and live in the web application itself.
