Abstract
IEEE standard 519 was first released in 1982 and was then updated in 1992. It defines limits on total harmonic distortion (THD) as well as total demand distortion (TDD) with regards to both voltage and current. These distortions are typically introduced into utility lines through non-linear loads installed in various types of manufacturing facilities. Such equipment consists of variable frequency drives, uninterruptible power supplies, and other types of rectifiers used to convert power from AC to DC.
Limits Set by IEEE 519
First, let us define VTHD. VTHD is defined as the Total Harmonic Distortion of the voltage waveform. It is the percent value of the ratio of the root sum square value of all the voltage harmonics to the voltage of the primary harmonic. The mathematical equation for this is as follows:
VTHD = (V2² + V3² + V4² + V5²…) / V1 × 100%
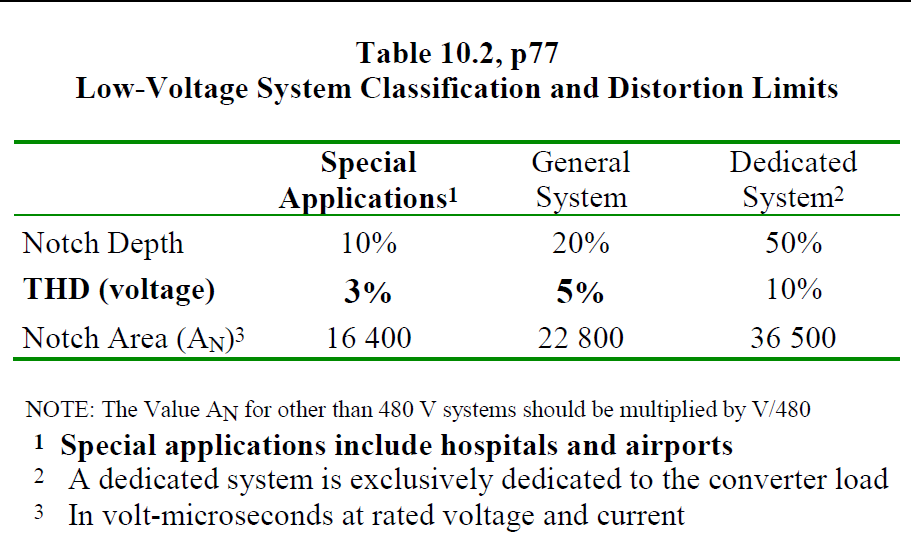
The voltage harmonic limits are set in three stages. The first is for special applications, which include medical facilities, airports and other sensitive areas. The limit set in Figure 1 for VTHD is less than or equal to 3%. For general systems, the limit is 5% with no single harmonic being greater than 3%. For lines dedicated exclusively to a particular converter load, the limit is 10%.
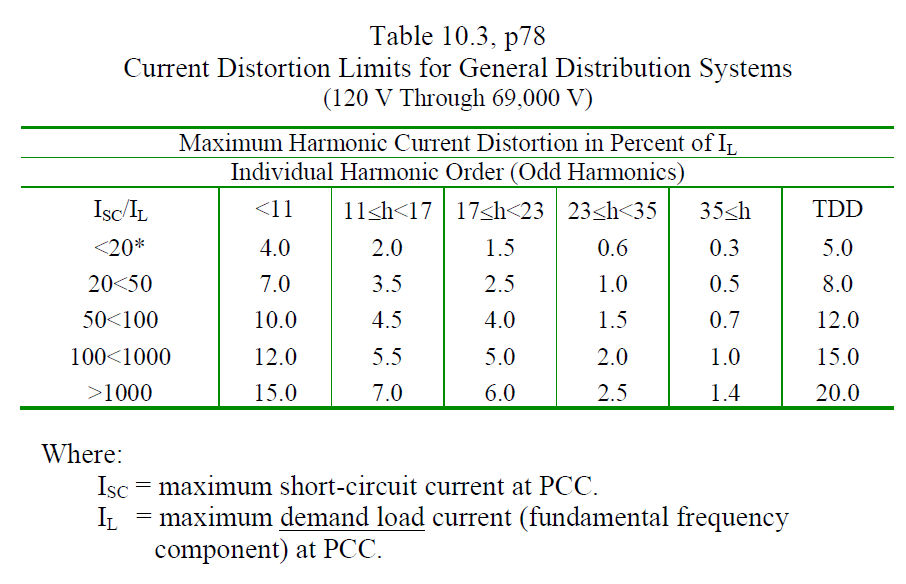
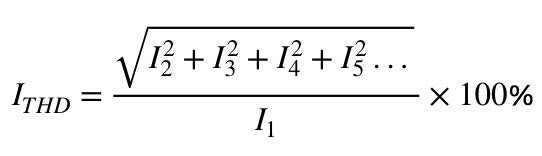
Current distortion limits are set by the ratio of ISC, the short circuit current to IL, the demand load current. The formula for the total harmonic distortion of the current waveform (reference in Figure 2) is similar to that for voltage.
Current total demand distortion (ITDD) is the percentage ratio of the root-sum-square value of the harmonic currents to the maximum demand load current. Its formula is:
ITDD = (I2² + I3² + I4² + I5²…) / IL × 100%
Here, IL, the demand load current, is defined as the “average current of the maximum demand” for the previous 12 months.
ProVision, Recorder Settings, and Initialization
In order to record VTHD and ITHD, you will first need a capable device and set up to record that data. In this case, the Revolution unit with harmonics is used. When initializing the Revolution recorder in ProVision, you need to access the advanced settings to activate the voltage and current total harmonic distortion features. You may also set to which harmonic you wish to record (can go to the 52nd harmonic) as well as the length of time you wish to record. Do not leave the recorder set to record only when events occur as there may be no events outside your set parameters. The recorder needs to be set to record continuously.
In order to set the proper initialization on the recorder, you will first need to access the initialization setup screen. In ProVision with the recorder attached, right click the serial number of the unit. A window will open with the standard initialization settings. You will need to select the advanced tab to enable the recorder to monitor for total harmonic distortion. You may also set up the continuous record function from this screen. While the THD record functions are initially not accessible, you will first need to set the range of harmonics you wish to examine. The Revolution recorder can record up to the 51st harmonic. Once you have turned on THD measurement and set your harmonic range and record time, you need to finalize the initialization. Once the unit is set on site and connected to the voltage source, the recorder will go through an initial countdown prior to recording (the status light flashes once per second during the countdown phase).
Placement of Revolution Where and Why
One of the most fundamental issues to determine compliance with IEEE 519 is, “Where do I take my measurements?” According to the standard, all measurements should be taken at the point of common coupling, or PCC. This is defined as ‘the closest point on the utility side of the customer’s service where another utility customer is or could be supplied’, typically at a transformer or substation. If located at a transformer, the PCC may be located on either the primary or secondary side. It is recommended that measurements be taken from the secondary side to ensure compliance, as it will be closer to the source of distortion and not suppressed by the transformer itself.
Retrieving Data Samples, Charts and Graphs
Once the duration of your recording is complete, you may either retrieve the recorder or download the file via remote access (typically cell connection or ethernet). Once downloaded, both voltage and current THD data can be read as either a chart (Figure 3) or as a visual graph. Access to the charts is done by going to report, selecting interval and choosing either current or voltage THD. Each value can be read as a percentage to compare to the maximum value allowed charts contained in IEEE 519.
Analysis of Results
Using data from the chart, you can now compare that data to the VTHD limits set in the standard. It is important to remember that there are 3 levels of service; general systems, dedicated systems and special purposes. This determines the acceptable level of distortion. ITHD similarly divides into 5 levels based on the ratio of ISC/IL.
As an example, we will look at a recording made earlier for a test sample, shown in Figure 4. In this sample, the user can draw the 3% lines. Only the average is shown, which is recommended over the readings of the maximum or the minimum. The table in Figure 5 shows a block of data from a VTHD recording. As you examine the data, you will notice that channel 1 has recorded values in excess of 3%. If this were a recording for a facility classified as “Special Purpose,” a fix would need to be made. The data from each voltage harmonic can be examined to find the specific harmonic (or harmonics) causing the problem. The data does indicate that the harmonic distortions are acceptable for the other 2 classes.
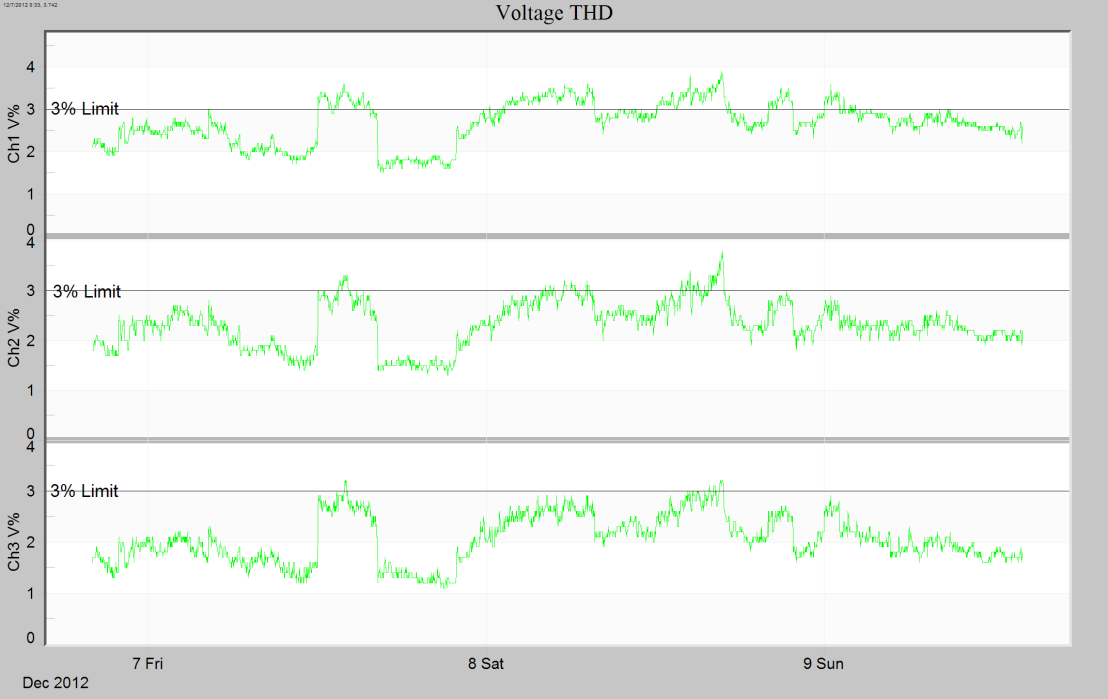
The graphic data can also be used to determine the acceptability of PQ. Note that at some point, all 3 channels exceed the 3% value needed for the “Special Purpose” category.
ProVision can also be set to display Total Demand Distortion (ITDD) if you know your maximum load current. To view this, select Total Demand Distortion under the reports tab. You will be prompted to enter the value for your maximum load current. With these 3 tools, VTHD, ITHD and ITDD, you should be able to verify compliance with IEEE 519.
Corrective Action Possibilities (Caps and Filters)
In the event that a problem is found where a customer exceeds the recommended amount of harmonic feedback, there are several steps that can be taken. The most common corrective action is to install filter traps near the PCC to eliminate the specific harmonics that are causing the issues. In certain other cases where there are problems with multiple customers or there are multiple harmonics causing problems, a capacitor bank can be utilized to provide the VARs needed to remove most of the distortion.
Conclusion
Due to the increasing use of voltage rectifiers, UPS’ and variable frequency drives, it is important to verify that the use of these devices does not affect the power grid system to its detriment. Harmonic distortions can cause failures and instability in localized parts of the power grid. In order to prevent these problems, it is important to verify that the standards set down in IEEE 519 are being met. The use of PQ monitoring equipment can not only verify that these problems are being addressed, but also keep them to a minimum by making sure that changes or facility expansions are not going unnoticed. This will result in both proper monitoring of VTHD and ITHD, as well as in a more stable power grid.
