Abstract
The ITIC curve (formerly CBEMA) is a performance-oriented standard for electronic equipment manufacturers. The standard gives a method for classifying and plotting voltage events on a specially constructed graph that defines regions of continued operation, equipment failure, and damage. A simplified presentation is described here for identifying likely ITIC events on a standard RMS voltage stripchart graph. This method is easier for correlating voltage events with load changes and can be more understandable to residential utility customers.
CBEMA Basics
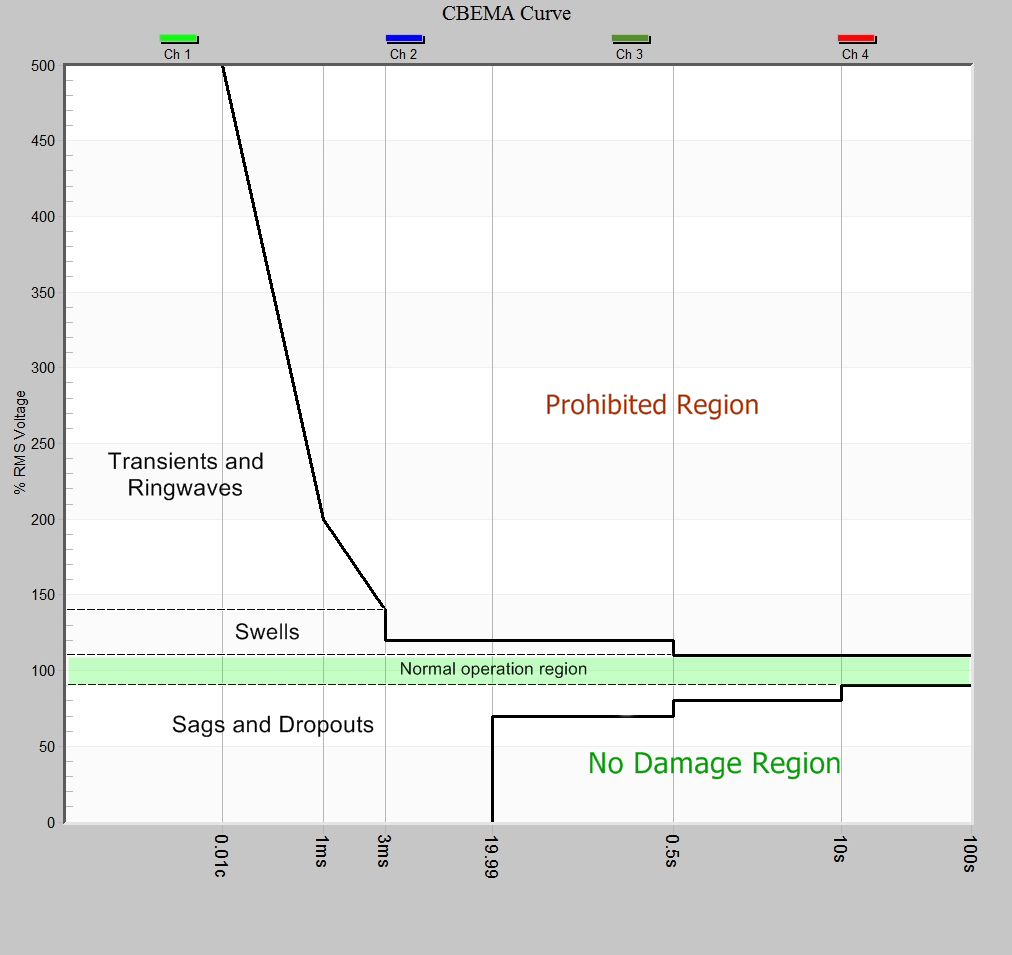
As explained in the whitepaper CBEMA and ITIC Curves, the ITIC standard classifies voltage events into several regions. As shown in Figure 1, the graph spans a large range of time scales, from fast impulsive transients on the left side, through slower oscillatory transients, more common RMS voltage swells and sags, and finally steady-state voltage on the right. The vertical axis is given in voltage percent of nominal, but this scale transitions from instantaneous to RMS voltage as the X-axis moves from left to right. The standard doesn’t give precise definitions for these classifications and measurement transitions. Voltage events are classified by the PQ recorder and plotted on the ITIC graph with ProVision or PQ Canvass cloud-based software.
Although the intent of the ITIC graph is to simplify the analysis and provide a clear boundary between compatible and non-compatible events, it can also be helpful for several reasons to view the events and thresholds in stripchart form. For PQ recorders without native ITIC recording (e.g. the Eagle), this is especially useful.
Stripchart Data
The RMS voltage and current stripcharts operate uniformly among all PMI recorders. A recording interval is selected, ranging from 1 second to 15 minutes or longer (the cycle interval is a special case not applicable here). The default interval, 1 minute, gives reasonable time resolution and provides for long recording times even with legacy recorders. Interval times of 10 and 1 second are increasingly common with the Revolution and cell Guardian (the latter especially with the use of cloud-based storage, removing memory limits). These give better time resolution, and also allow a closer match to the ITIC classifications.
Stripchart data is logged at every interval time. The lowest and highest single-cycle RMS values are recorded, along with the average RMS value through the interval. These are graphed as three stripchart traces in ProVision, with each channel of voltage or current appearing in a separate plot on the graph. Although the min and max values are plotted with each point connected by lines, it should not be implied that the min/max values transitioned smoothly from one to another between intervals. The duration of a sag or swell as seen in the stripchart is not logged – only the worst-case single-cycle RMS reading during the interval.
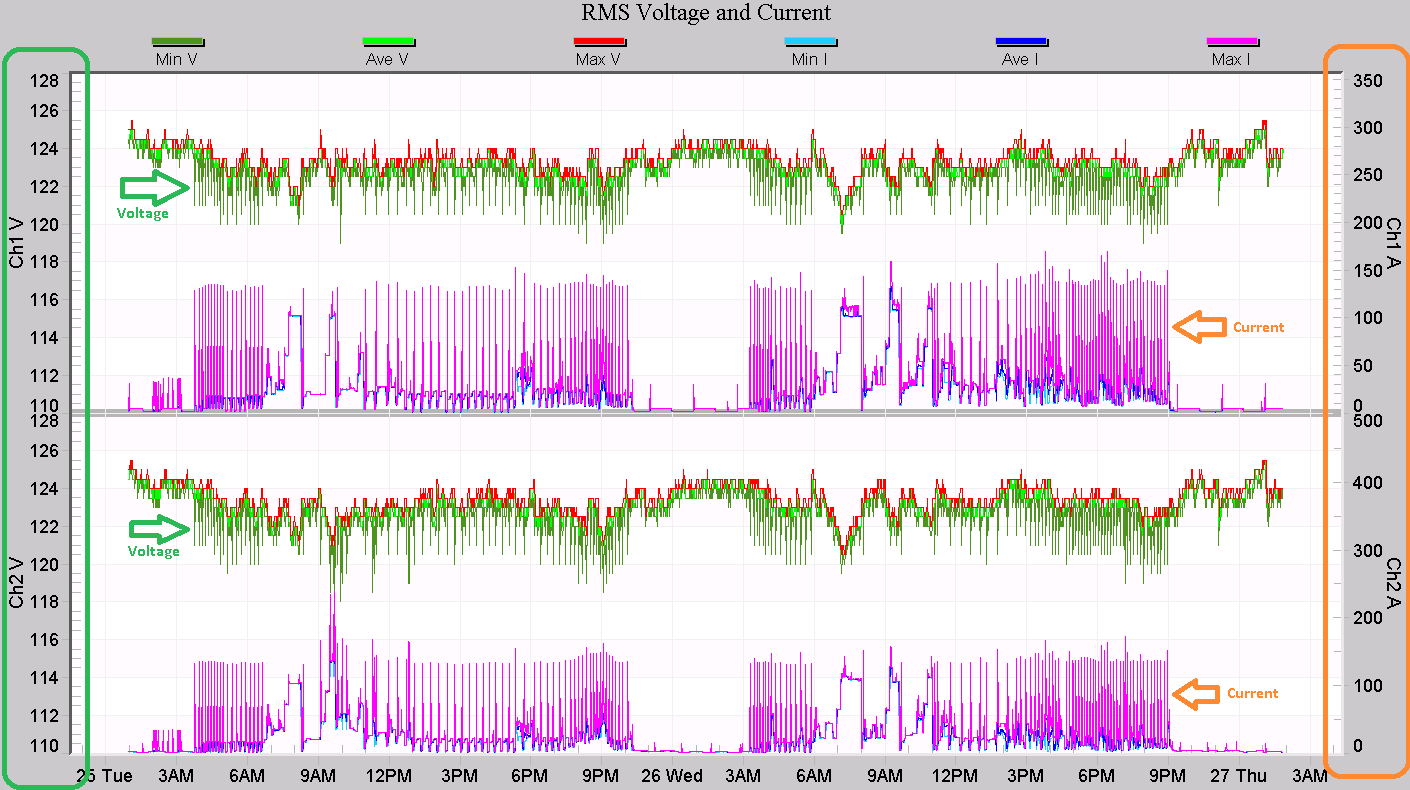
An example single-phase stripchart is shown in Figure 2, with both channels of voltage and current plotted. Channel 1 voltage and current traces appear on the upper plot, channel 2 on the lower plot. The voltage is scaled by the left Y-axis, highlighted in green. The voltage min/ave/max traces are plotted together with dark green, light green, and red, respectively. The current traces are drawn on the same plots, scaled with the right Y-axis (highlighted with orange). Current min/ave/max data are plotted with light blue, dark blue, and purple, respectively. The most common situation shows mostly voltage sags (RMS min trace, dark green) caused by current spikes (RMS max trace, purple). This pattern is apparent in Figure 2.
ITIC Events in the Stripchart
The most common residential problem captured by the ITIC curve is an RMS voltage sag. RMS events are measured from a 20 ms (0.02 seconds) time span up to 100 seconds on the ITIC graph, representing RMS sags/swells up through steady-state voltage regulation. These are easily visualized with the RMS stripchart graph, especially with an interval in the 1 to 10 second range. The 20 ms time is close to the 1 cycle min/max time period in the stripchart (the 1 cycle period is a bit more conservative). The ITIC limit for 0.02 to 0.5 seconds is 70% for sags and 120% for swells. From 0.5 seconds through 10 seconds, the limits are 80% and 110%. From 10 seconds and longer, the limits are 90% and 110%. Because the RMS stripchart only shows the worst case 1 cycle value each interval, it’s not possible to determine the event duration solely from this data. Thus, distinguishing between a 1 cycle or 0.5 second event duration (necessary for separating an 80% allowable sag from a 70% disallowed sag) isn’t strictly possible.
A conservative approach can be used to make use of the stripchart data without being able to distinguish event duration between 1 cycle and 0.5 seconds. Using the 80% sag threshold down to 1 cycle creates a limit that is a bit more strict than the default ITIC curve, but allows for consistent use of the stripchart single-cycle response. Swells are much rarer than sags, especially in residential applications. For swells, the lower 110% limit may be used to cover from 1 cycle up to the interval period itself.
An example of the ITIC-annotated stripchart is shown in Figure 3. ITIC thresholds are set as a percent of nominal, here defined as 120V. The 80% and 110% thresholds are drawn with ProVision horizontal line annotations, colored green and red, respectively (to match the green 1 cycle min and 1 cycle max trace colors). If the min voltages are above the green threshold, and the max voltages are below the red threshold, no RMS ITIC events outside the limits have occurred. It’s possible a fast oscillatory or impulsive transient would not appear on the stripchart, but for voltage sags, these are too fast to lower the RMS voltage appreciably. Overvoltage due to impulsive transients are rare at the residential level, and are outside the scope of this simplified technique. For more information on how to draw the stripchart annotations themselves, refer to the paper Annotations in ProVision.
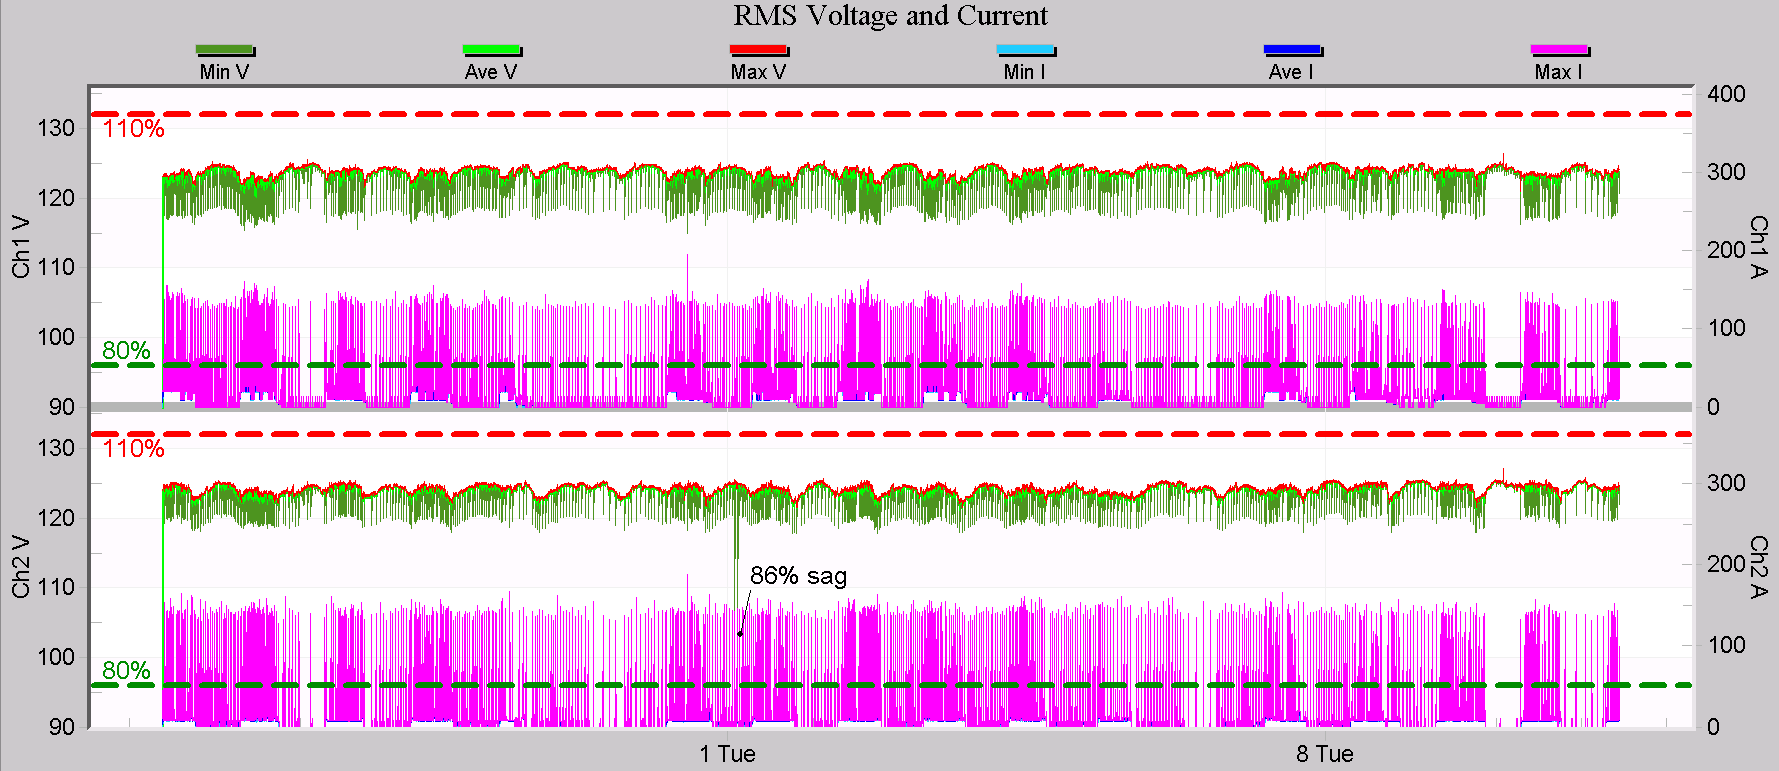
In this example there are many typical voltage sags of several volts, all correlating exactly in time to spikes in local current. These sags are likely to be noticeable as light flicker, but should not cause misoperation of electronic equipment – they are above the ITIC limit of 80%. The only significant sag is near the middle of the graph for channel 2. This has been annotated separately with a 1 cycle minimum of 86% of nominal. This is still obviously above the ITIC 80% limit, and even further above the looser 70% limit that applies to sags under 0.5 seconds in duration. Here we don’t know the duration of the event, but because it’s above the more strict 80% threshold, it is within the ITIC limit even if the duration is up to 10 seconds. The average interval trace may be used to put an upper limit on the duration.
For the steady-state voltage regulation portion of the ITIC curve, the RMS average trace is applicable. This is available on a separate graph, to reduce the clutter present with the min/max voltage and current traces. Figure 4 shows a 3-phase example. Here the three phases are drawn on one plot, and the ITIC 90% and 110% thresholds are drawn. The ITIC limits are significantly looser than the 5% ANSI limits that most utilities adhere to at the service entrance. The voltage in this example is well within the ITIC boundaries.
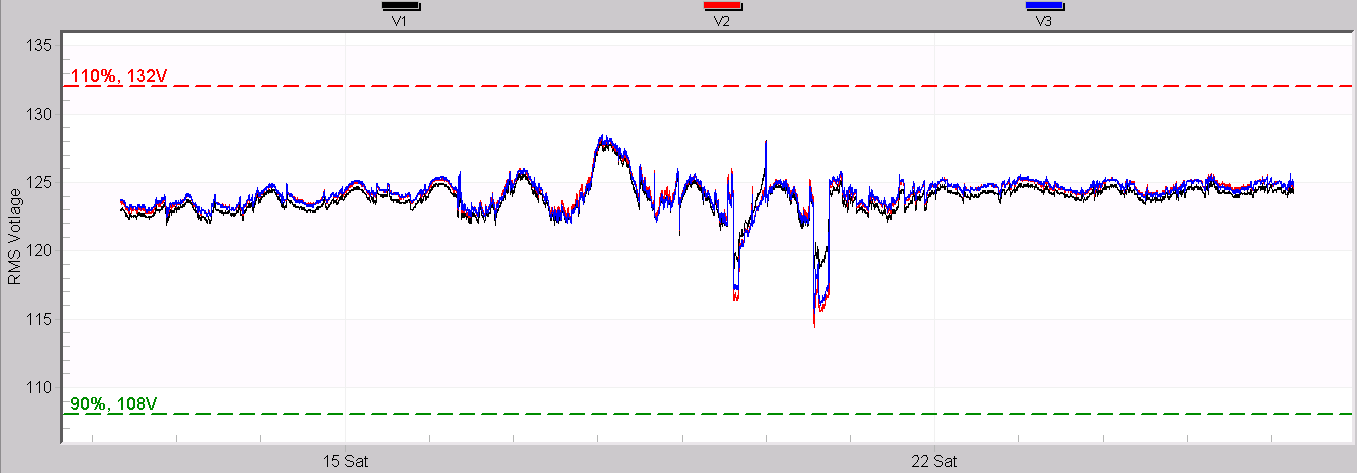
These RMS stripchart graphs are easy to show and review with electricity end-users, and illustrate good voltage regulation compared to the ITIC thresholds. They also provide information on ITIC/CBEMA event limits for PQ recorders without native ITIC event capture.
Conclusion
The ITIC standard classifies voltage events into several categories, each with their own thresholds and measurement types appearing on a single graph. In many cases the RMS voltage stripchart, with single-cycle RMS min/max and interval average data, can provide similar information on an easy-to-read graph that translates well to non-professionals. A method is shown here to capture the most pertinent ITIC thresholds (especially for residential applications) on the stripchart plots, creating graphs to demonstrate ITIC compliance, even in recorders without native ITIC capture.
