Abstract
The CBEMA (Computer Business Equipment Manufacturers Association) curve and the ITIC (Information Technology Industry Council) curve both refer to a similar method to visibly represent voltage events. A graph of these events gives a general picture of voltage stability as captured by either a Revolution or Cell Guardian recorder. CBEMA data captured in a recording can be displayed in both graph and table form in PMI’s Provision data analysis software. This whitepaper will describe the details of the CBEMA data and how the data values relate to the graphed points.
CBEMA Voltage Events
The CBEMA graph is meant to show voltage events that are outside of the expected norm. A clear graph or a graph with a very small number of points means there have been little or no voltage disturbances. Data points on the graph represent a deviation from the expected voltage with an associated duration so it is important to note exactly what type of events are being captured as CBEMA data.
The measured voltage events fall into one of three defined types. The types are indicative of the duration of the event with type I being very short (less than 20 milliseconds), type II being noticeably longer (20 milliseconds to 10 seconds) and type III being longer still (more than 10 seconds). The measurement of an event is started when the voltage level deviates from the norm. The event ends and will be graphed when the voltage returns to the expected norm. Graphed events that fall outside of the boundaries of the CBEMA curve have the potential to damage connected equipment.
Instantaneous Voltage Versus RMS Voltage
Up until now in this discussion, the definition of the norm and the measured voltages has been purposely vague. There are two different measurements occurring within the recorder for collecting CBEMA data. The actual measurements are considered to be outside of the expected norm based on the type of measurement.
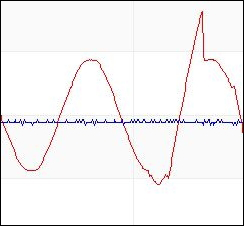
The most basic measurement is the instantaneous voltage as read on a voltage input at a single point in time. The input voltage is an AC sine wave so the instantaneous voltage changes with each reading. The change in voltage for each reading is mathematically predictable so any value that deviates from the expected sine wave by more than 40% is a CBEMA type I event. Figure 1 shows a waveform capture that also produced a CBEMA type I event. The slight disturbance at the bottom of the waveform was not a significant deviation that would have generated a type I event but the spike at the top of the waveform certainly was.
The more common RMS voltage is a calculated value based on the collection of instantaneous voltages that make up a cycle (sine wave). Subsequent RMS values of each cycle are averaged together to get the total RMS voltage over time. Any RMS value that deviates from the nominal voltage by more than 10% may become a CBEMA event. An RMS deviation will only become a CBEMA event if it is large enough for a very short period or if it persists beyond one or more of the defined time limits. An interesting fact about calculating the RMS voltage is that only one-half of a cycle is required. This is important for graphing events as detailed in the next section.
Provision’s CBEMA Graph
In reality, the graph being utilized in Provision is the ITIC version. It features discrete boundaries for voltage and time measurements that can more accurately delineate the values being presented. Events that are shown within the boundaries are considered safe for most systems. Events outside the boundaries are potentially damaging for equipment depending on the level of the voltage and the duration. At first glance the graph looks simple enough but a closer examination of the axes reveals some subtle complexity. Notice that far left side (smaller duration) and lower left side (lower voltage) define the bulk of the safe zone.
The horizontal axis (x-axis) represents the duration of the event but note that it does not increase in linear steps. The time division markings begin at zero and the first step only goes to 0.01c. This value is one hundredth of a cycle. In a 60Hz system, one hundredth of a cycle is approximately 0.000166 second. A very small amount of time which makes sense for the transient voltage spikes that would be graphed in this region. The next increments on the x-axis are 1 millisecond (0.001 second) and 3 milliseconds (0.003 second) respectively. These values are still quite small but larger than transient spikes and smaller than the minimum time required for calculating an RMS value. As mentioned in the previous section, an RMS value can be calculated beginning with one-half of a cycle. This equates to approximately 8.4 milliseconds (0.00833 second) which is not represented on the graph but falls into the range between 3ms and 20ms. This covers the first half of the x-axis with the remainder rapidly increasing to 0.5 seconds, 10 seconds and then 100 seconds. These x-axis durations tie directly to the event types described above. Type I events go up to 20ms (milliseconds) which is a little more than one full cycle of voltage. Type II events cover the range from 20ms to 10 seconds and type III are those that exceed 10 seconds.
The vertical axis (y-axis) represents the magnitude of the voltage. Note that while it does increase in linear steps it actually represents a percentage of the nominal voltage from 0% to 500%. The 100% marking on the graph is the nominal voltage of the recording (120v, 208v, 240v, etc).
Graphed events will show as color coded dots per channel. The dots will be circular for positive values and triangle shaped for negative values. The voltage RMS values are always positive due to the nature of the calculation. The instantaneous voltage transients can be positive or negative with the value representing a positive or negative deviation from the expected sine wave.
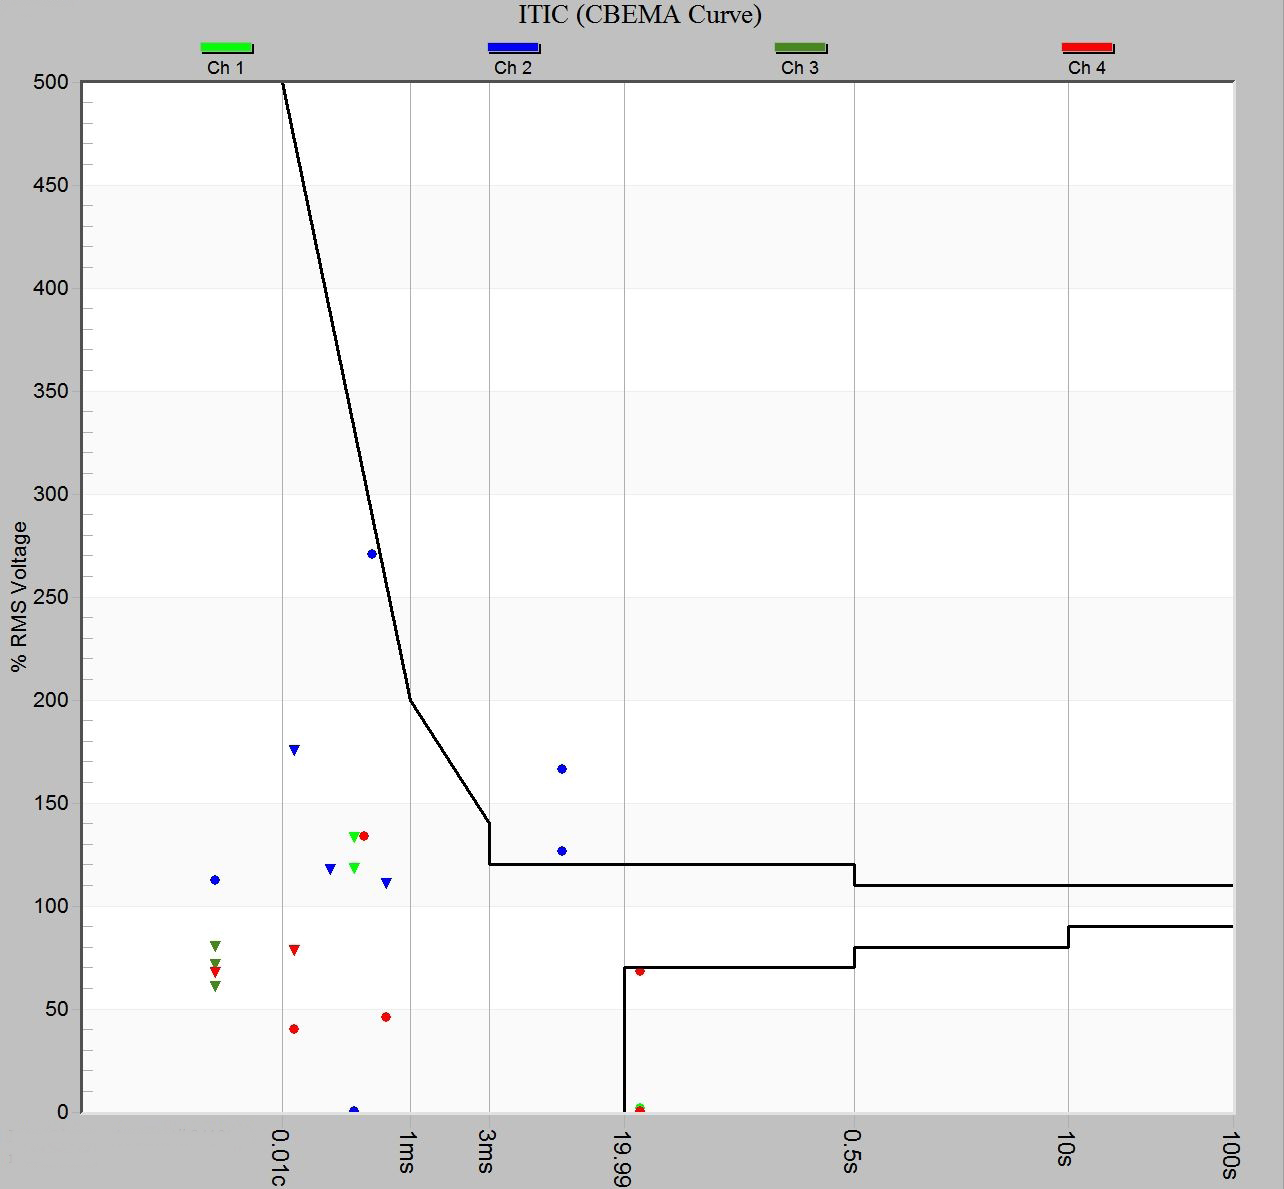
Figure 2 shows a screenshot of an ITIC (CBEMA Curve) from a Provision recording. A good bit of information can be determined by simply viewing the graph without looking at the underlying event data. All 4 channels have events recorded. The majority of the events fall within the safe (no damage) zone. Most of the events are type I consisting mainly of minor transients. There are two voltage surges lasting one cycle or less on channel 2. Both of these are type I events. There are a few voltage sags on multiple channels lasting more than one cycle. Each of these is a type II event and there are no type III events.
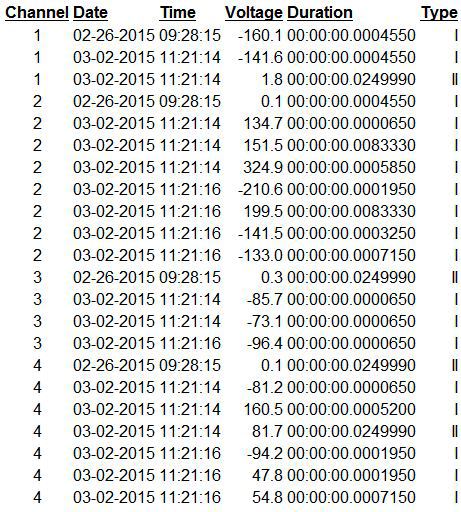
The CBEMA Report shown in Figure 3 lists the events that were graphed. The report lists the complete details of each graphed event. The voltage in the report is the actual instantaneous or RMS voltage measured (not percentage of nominal that is graphed). The duration is shown in seconds and fractions of seconds. The rest of the data is self-explanatory and will match with the graphed points. There may sometimes be an event graphed in the safe zone with an event type of none. This indicates that a CBEMA type II or III event started and didn’t last long enough to exceed one of the time boundaries. Very often a waveform capture will be triggered when a CBEMA event occurs so it can be informative to cross reference these events with captured waveforms.
Conclusion
The CBEMA graph and associated report are only available using Revolution or Cell Guardian recordings. The feature must be enabled when initializing a recording by specifying the number of channels to monitor and the nominal voltage. Utilizing the CBEMA graph and report does not consume any additional recorder memory and it provides a handy visual glance of the overall voltage stability of a system.
