Abstract
Variable Frequency Drives (VFDs) present unique challenges as both a source of PQ problems as well as being sensitive to incoming voltage quality. A frequent complaint with a troublesome VFD is the controller taking the drive offline due to unbalanced current draw. This can be caused by high voltage unbalance from distribution, or from an impending failure in the VFD itself (which can then cause voltage unbalance). Separating the cause and effect of unbalanced voltage and current with a VFD is described here, and is crucial towards eliminating the root cause of the complaint.
VFD Front End
Figure 1 shows a basic “6-pulse” VFD schematic. The incoming 3 phase AC voltage is rectified by a series of diodes. This rectified voltage is smoothed into a DC voltage by filter capacitors, and sometimes inductance. The DC bus capacitance also provides some energy storage for sag ride-through, although its primary purpose is to “fill in the gaps” during the low points of the voltage sine waves. The motor controller contains a microprocessor which switches the DC bus voltage into variable-width pulses that are applied to the motor through semiconductor switches (usually SCRs or IGBTs) in the inverter section. By precisely controlling the width of the pulses applied to the motor, the controller can adjust the motor speed.
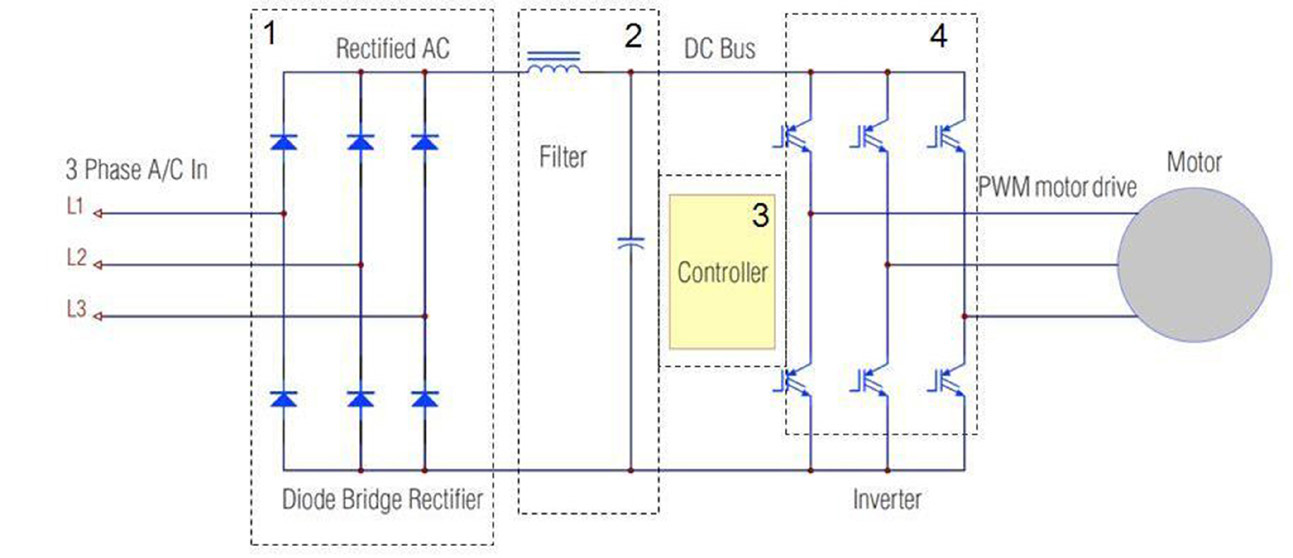
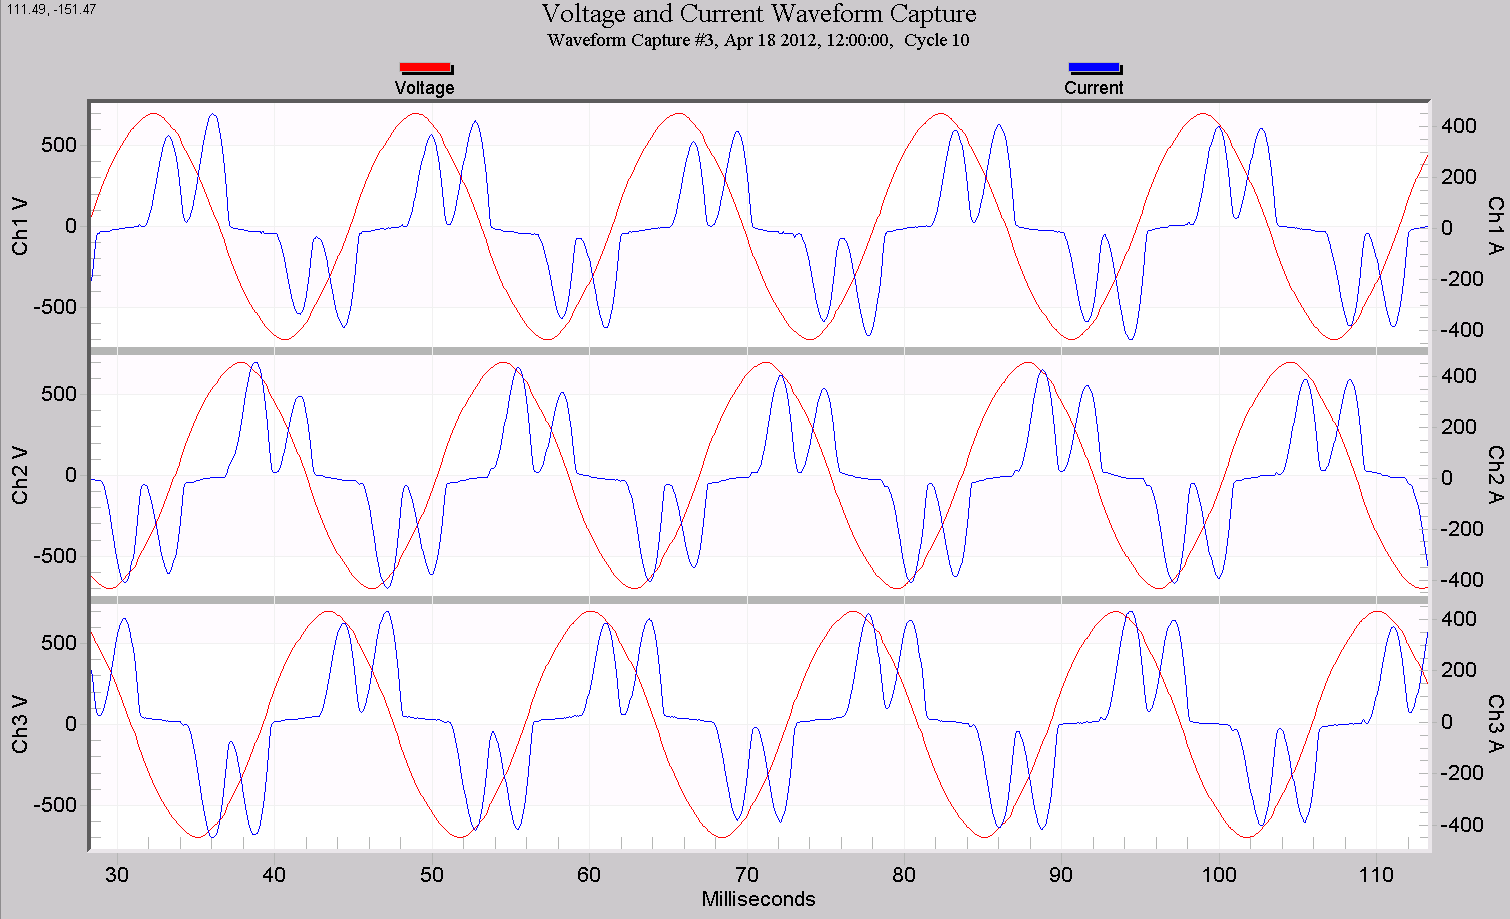
The AC current waveforms from a VFD are shown in Figure 2. The diodes conduct current from a pair of the 3 phases in turn, as each line-line voltage goes through a positive and negative voltage peak. This results in a total of 6 pulses in a 360° conduction angle, hence the “6 pulse” moniker.
Voltage and Current Unbalance
Voltage unbalance is a sensitive issue for VFDs. Unequal delta line voltages cause differing currents to flow in the pairs of diode rectifiers, resulting in unequal diode heating. For a constant power, the diodes with the higher voltages applied end up heating more than the rest. The diode currents and temperatures are measured by the controller, and it will nuisance trip due to “excessive” current unbalance or diode temperature. For a temperature exceedance, when the system cools, the motor operates normally until the unbalance is enough to overheat a diode string again. If the current unbalance is near a threshold, a small change in voltage unbalance could cause frequent VFD trips.
It doesn’t take much unbalance to cause problems. The currents in Figures 2 and 3 actually show a noticeable unbalance – ideally each current pulse would be equal in height. The voltage unbalance is only 0.4% here, but the current unbalance is much higher. The nonlinear nature of the VFD can produce current unbalance typically 10 to 20 times larger than the incoming voltage unbalance.
Current unbalance may also be a sign of an impending diode failure – a common failure mode for a VFD. In this case, the current unbalance is due to a differing impedance during the conduction angle in a diode string, rather than incoming voltage unbalance. This unbalanced current can itself cause a localized voltage unbalance, making it difficult to separate cause from effect. The customer complaint is often the same – the VFD controller takes itself offline, but in one case the solution is to reduce incoming voltage unbalance (or, more commonly, increase current unbalance threshold from the default 15% to the more reasonable 30% in the VFD controller). In the other case, the VFD itself should be repaired or replaced. There are a few techniques described below that can be helpful in separating these two situations.
Voltage/Current Unbalance Ratio
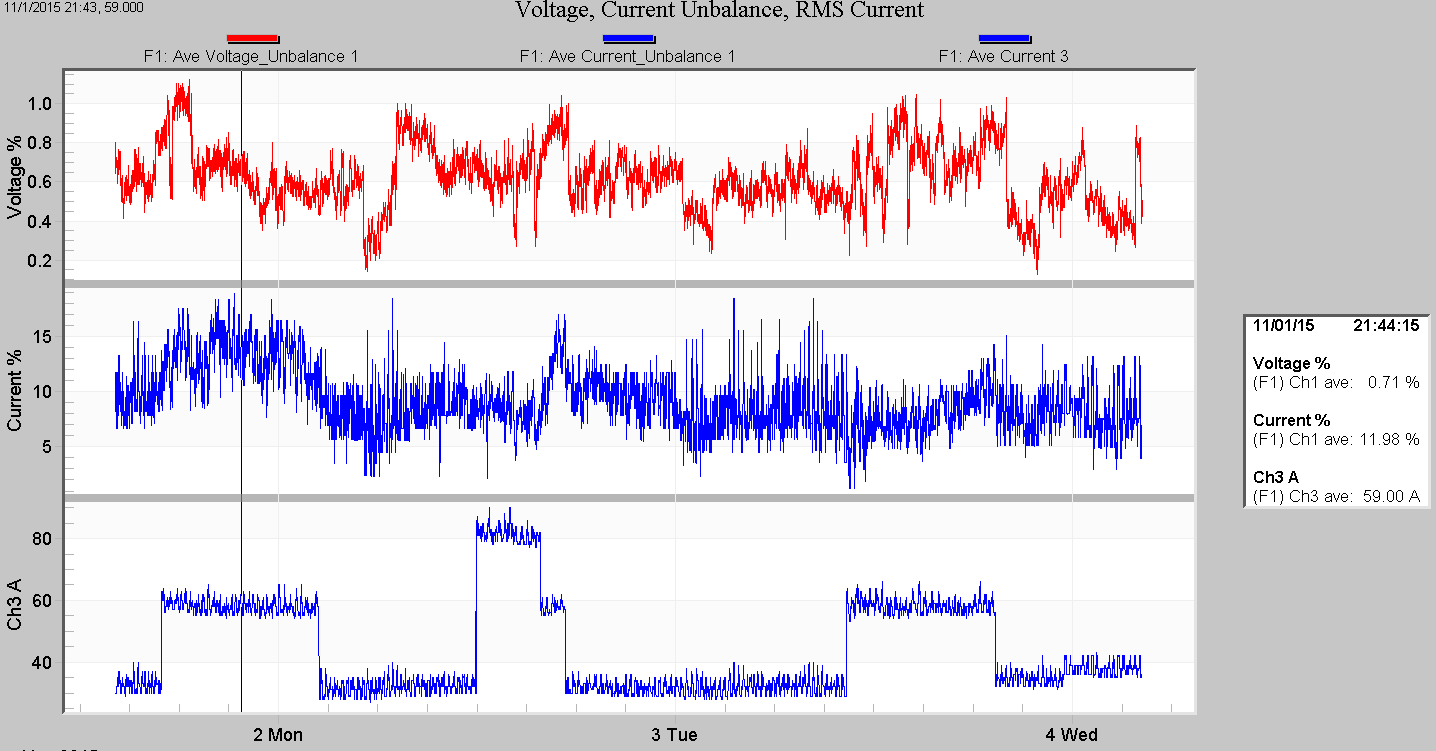
A “normal” VFD will produce a current unbalance of roughly 10 to 20 times the voltage unbalance. For example, an incoming voltage unbalance of 1.5% will result in a current unbalance of 15% to 30%. The unbalance magnification is due to the nonlinear nature of the diode bridge and the normal system impedance relative to the VFD impedance. ProVision computes unbalance automatically from recorded RMS voltage and current stripcharts and can be used to spot-check the voltage/current unbalance ratio. To generate the graph, choose Graph, RMS Interval, Voltage and Current Unbalance. The 3 phase unbalance for voltage and current will be plotted. The point table can be used to read the exact values from the graph, but for this purpose the result is only useful when the VFD is actually running. A mixed graph showing voltage and current unbalance along with RMS current is helpful in selecting representative instants when the VFD is actually drawing current. Figure 3 shows the result. Here the current (bottom plot) is 59A with the VFD running. The voltage unbalance is 0.71%, and current unbalance is 11.98%. The ratio, 11.98/0.71 is 18, within the normal range of a VFD. The relatively small 0.7% voltage unbalance is contributing significantly to the 12% VFD current unbalance.
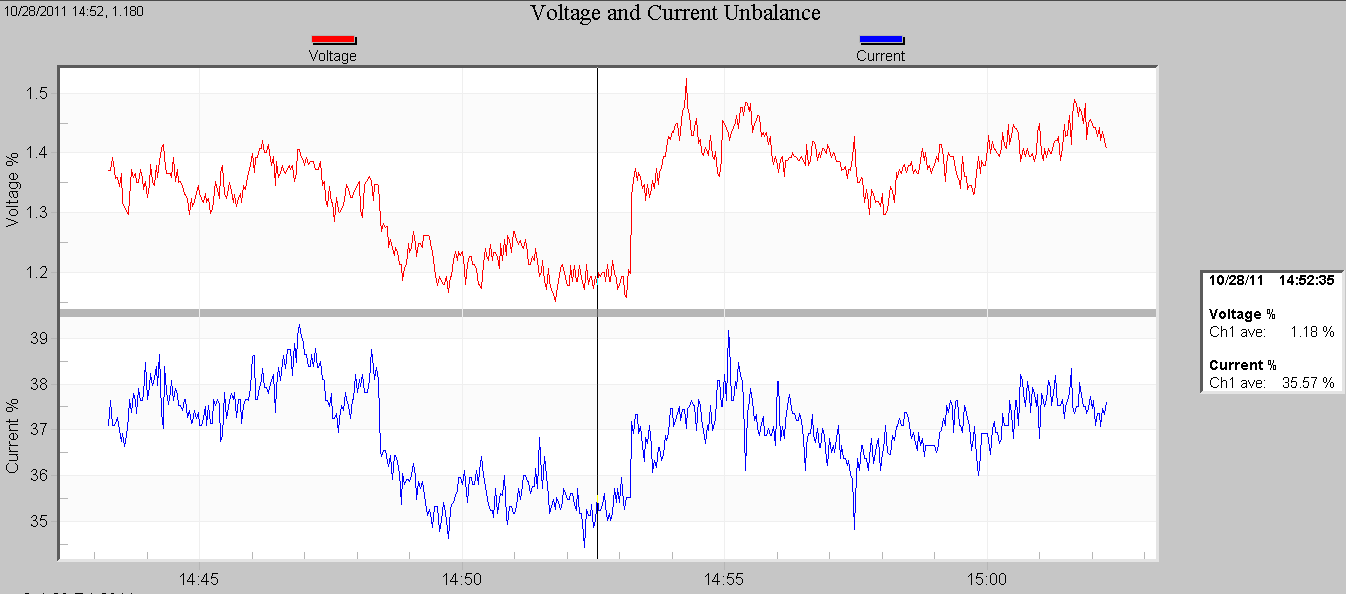
A more serious problem is shown in Figure 4. Here, the VFD is running continuously, so any point on the unbalance graph is valid for this analysis. A spot check is shown in the figure, with voltage at 1.18% and current at 35.57%. The ratio here is 35.57/1.18 = 30. A ratio this high suggests a problem with the VFD itself. The ratio is at least 25 even at the highest points of voltage unbalance (around 1.5%). As the voltage unbalance rises more of the current unbalance can be attributed to the incoming voltage, but even with a low value of 1%, the ratio is still 30. These high ratios indicate a failing VFD.
Raw Waveform Analysis
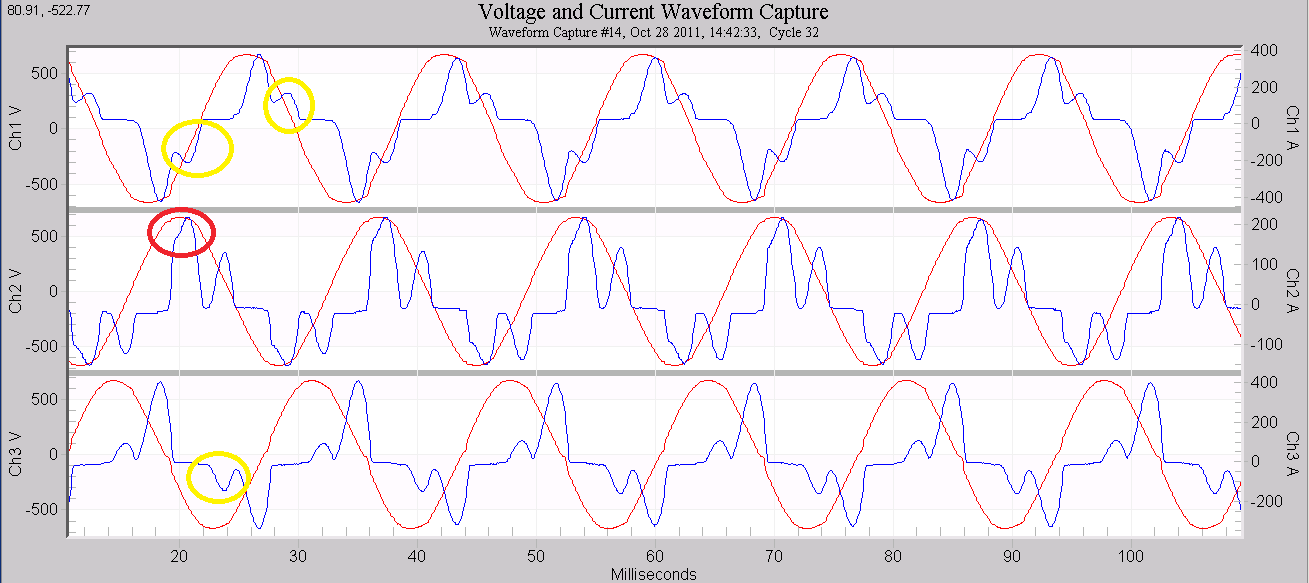
The VFD current waveform, if available, can produce direct evidence of an impending failure from a bad diode. In Figure 5 an imminent VFD failure is shown. Of the 6 pulses in a cycle, several are abnormally low (yellow), and one is very large (red). A waveform with a large difference in waveforms among the three phases is a red flag for a VFD. This asymmetry isn’t caused by voltage unbalance, and indicates a hardware problem with this unit. The customer will likely report frequent VFD shutdown due to unbalance or excessive heating, and this graph is good evidence that the problem isn’t caused by the utility. This waveform is from the same VFD as shown in the stripchart of Figure 4, to illustrate the waveform distortion required to produce a 30X voltage/current unbalance ratio.
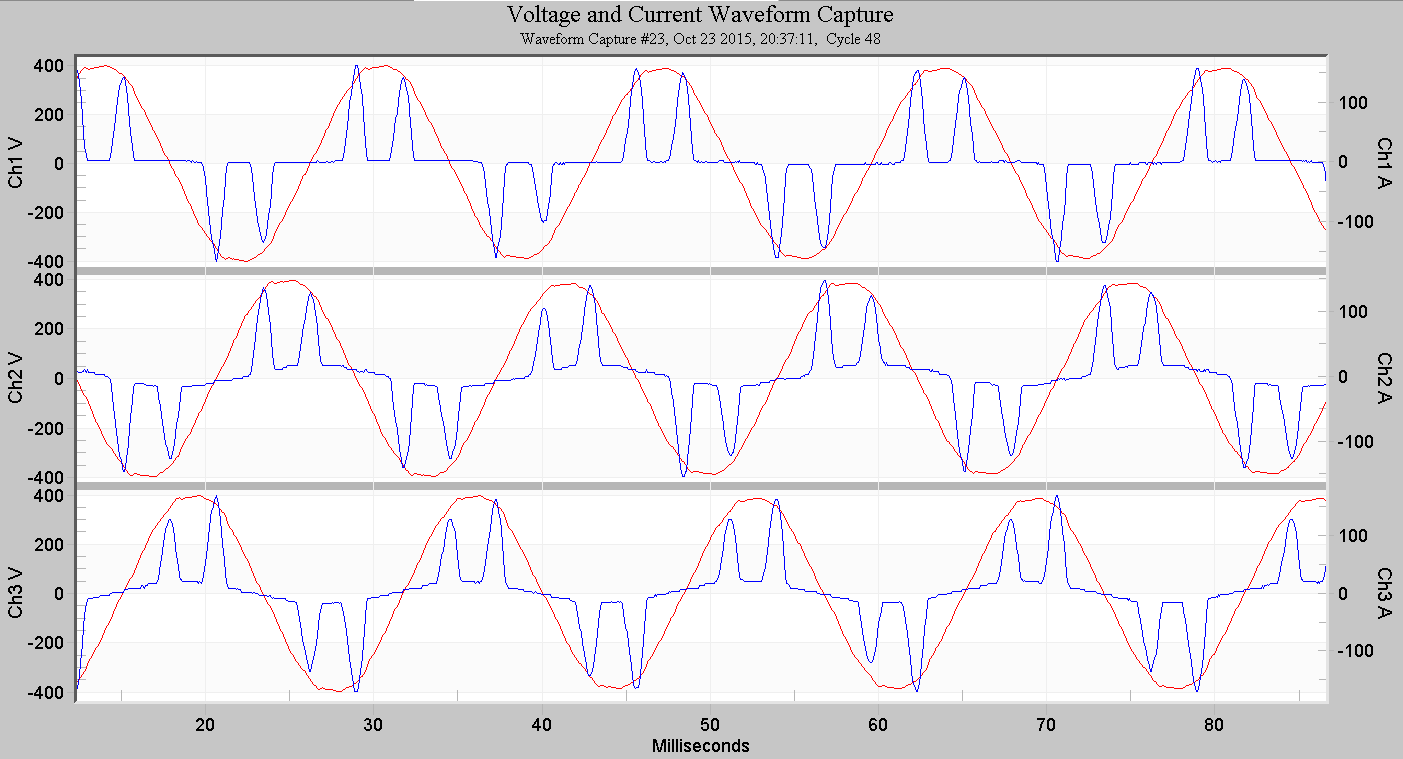
A small amount of current pulse height difference can be normal. This can be caused by voltage unbalance and actual (slight) VFD diode impedance differences. In addition, if the monitoring point includes other loads (e.g. at the service entrance or main panel), other loads will be present in the aggregate waveform. A typical example is shown in Figure 6. There is some normal pulse height variation, along with a small linear load present on phases B and C, but not A. The voltage/current unbalance ratio varies from 15 to 18 in this example.
Parametric Graph
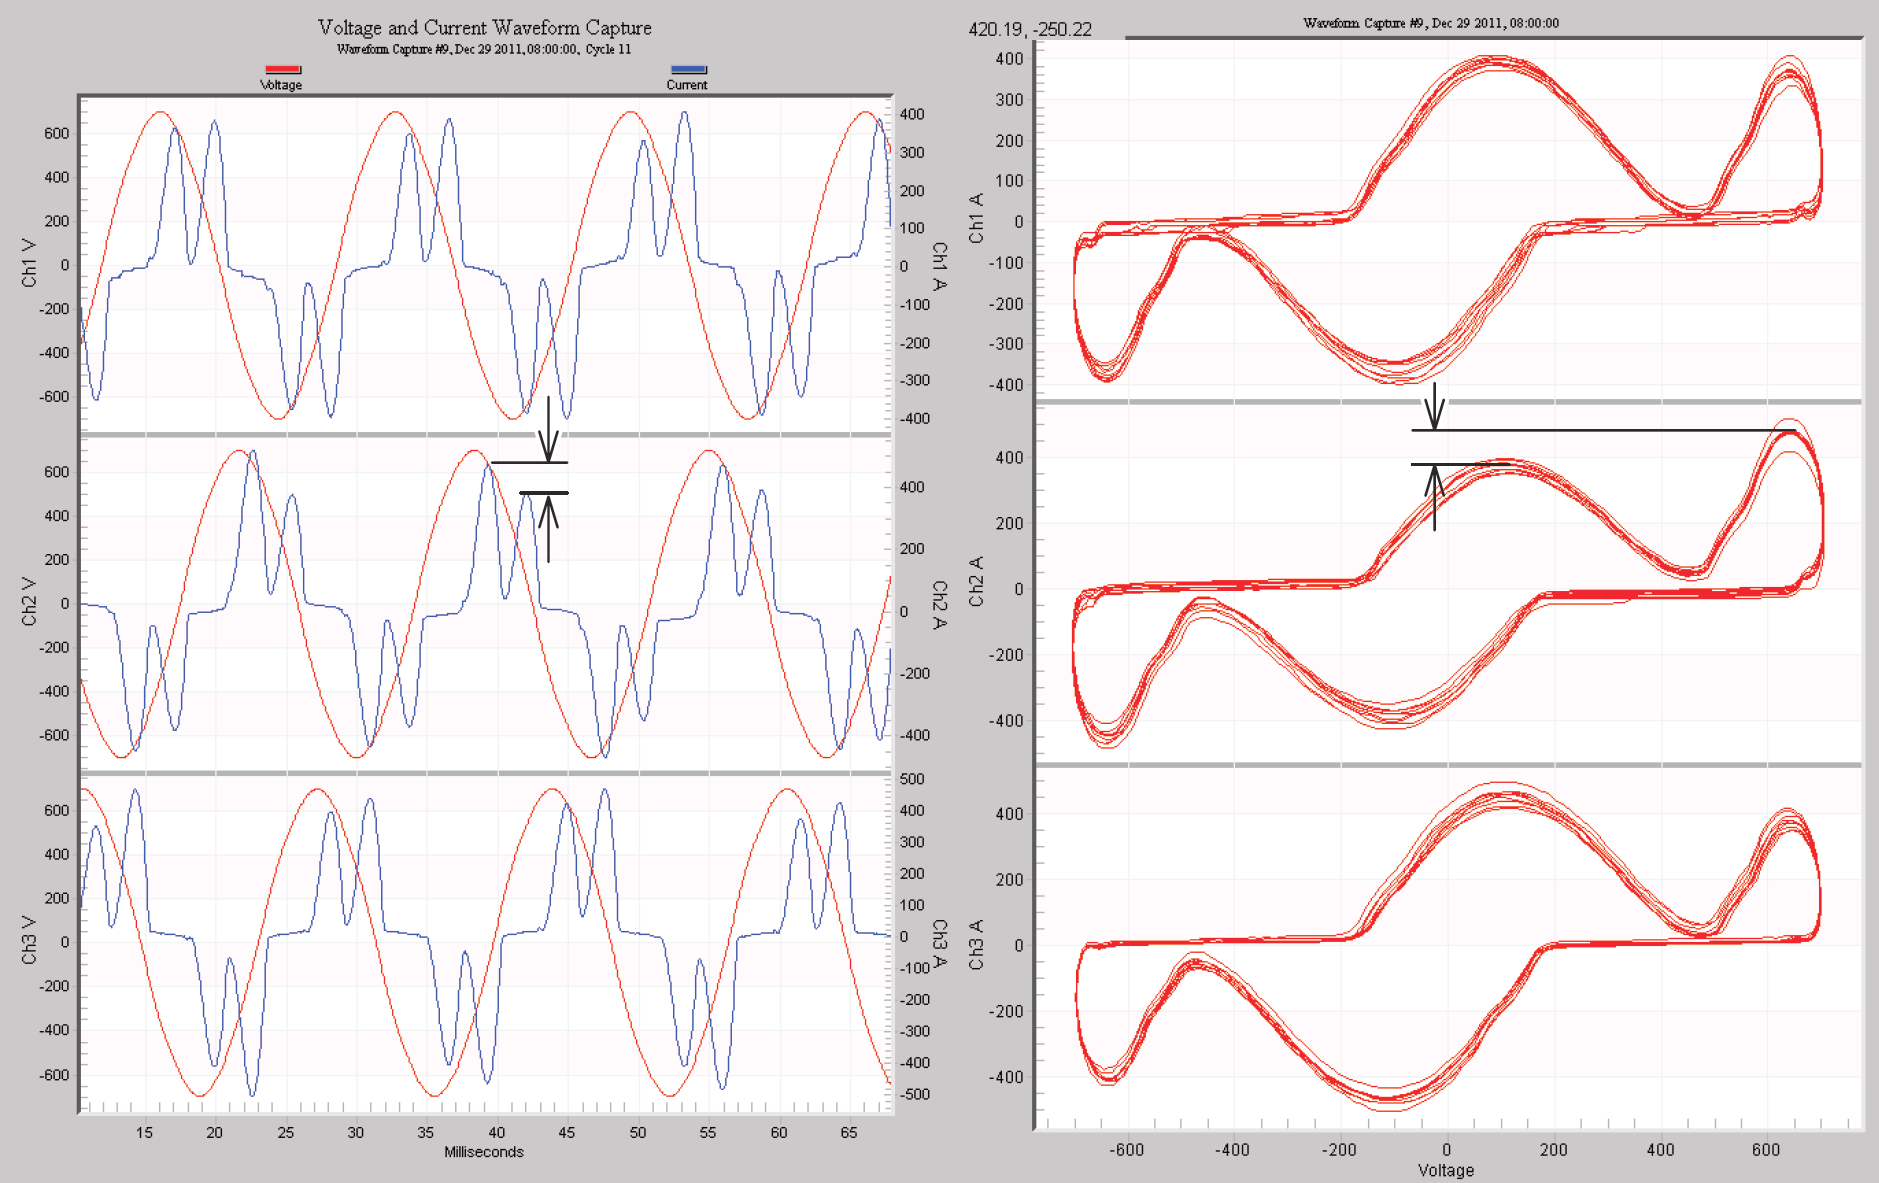
A parametric graph of the voltage and current waveform helps separate utility induced voltage unbalance from any inherent VFD impedance unbalance. With a parametric graph, instead of plotting voltage and current as a function of time, the current is plotted as a function of voltage. The resulting graph shows the instantaneous current drawn by a load for a given instantaneous voltage. The pattern is more of an impedance plot rather than a traditional time series plot. The current pulses in the time series waveform appear as lumps in the parametric plot (Figure 7). Here the time series (left) is plotted with the parametric version (right). The normal pulse height variation is shown on both plots. Note that the three parametric phase plots are all similar in shape.
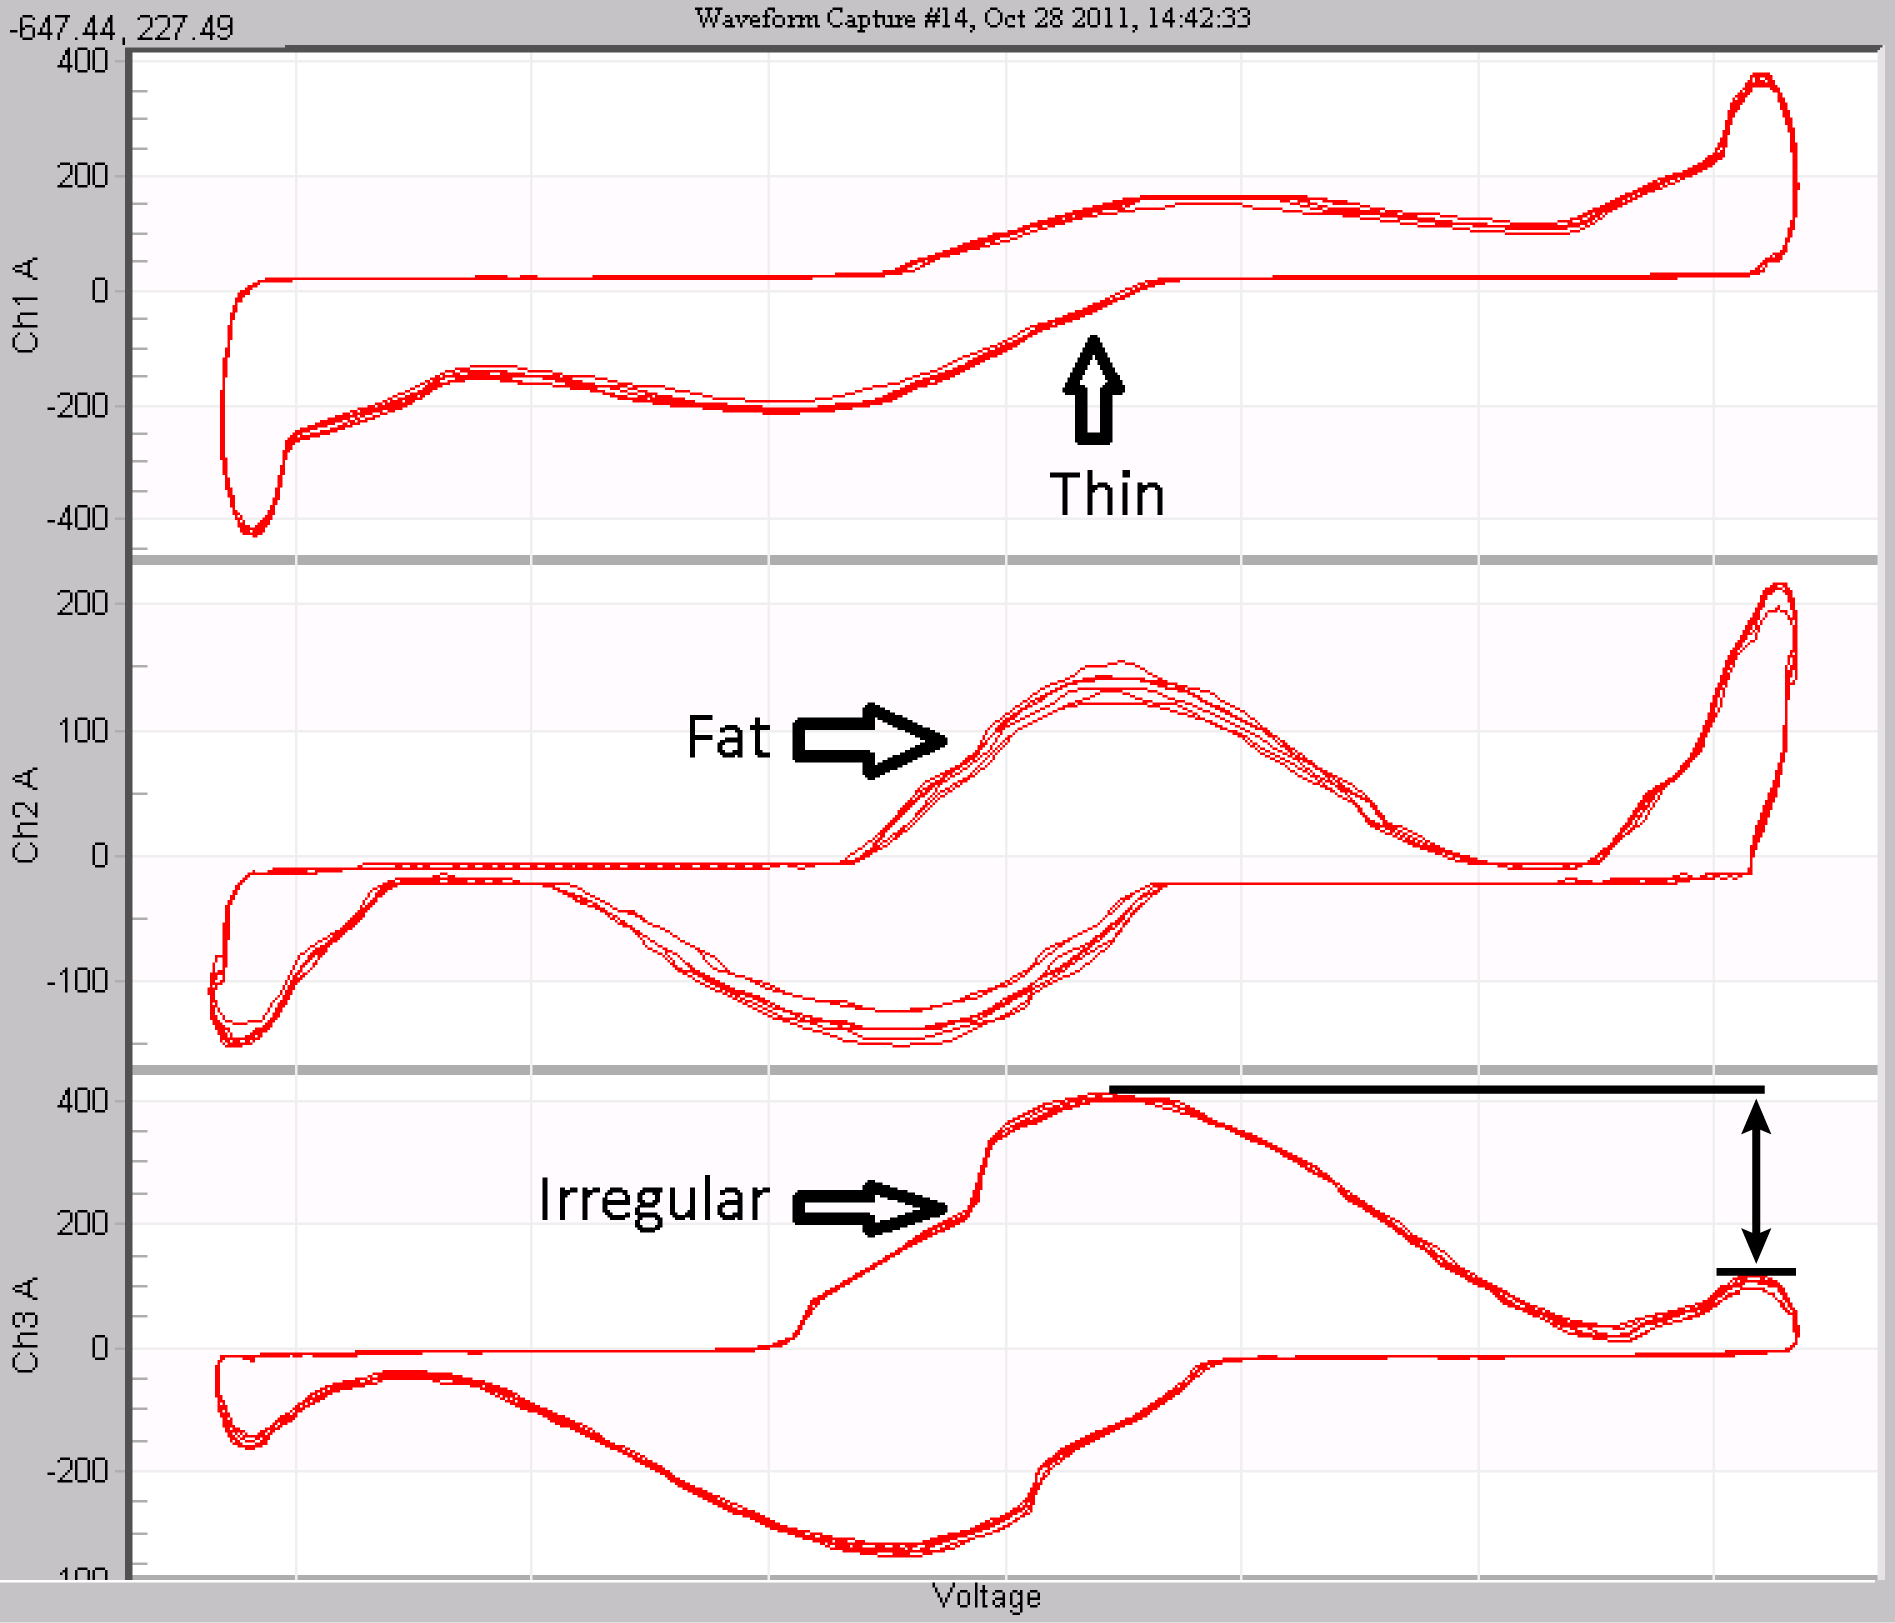
A severe case is shown in Figure 8. It’s immediately apparent that the three V/I plots are shaped differently. Phase A (top) is very thin, B is fat, and C has an irregular distorted main section. C’s right-most pulse is very small compared to the others. Because these plots are graphed against the actual voltage waveform, they represent impedance vs. instantaneous voltage, whatever that voltage happens to be. The result is more representative of the VFD bridge diode health itself, and helps separate current unbalance inherent in the load from that caused by incoming distribution voltage.
Conclusion
VFD complaints from customers are a common issue for utilities. Determining if a troublesome VFD is reacting to legitimate voltage quality issues, or having internal problems of its own is critical towards solving the complaint. Three methods of analyzing recorded VFD data have been shown here. The voltage/current unbalance ratio may be used to suggest that a VFD is drawing more unbalanced current than expected for a given incoming voltage. The raw waveforms can be conclusive if the VFD is about to fail in a severe case, especially if the voltage unbalance is low and the monitored current does not include other loads. The parametric graph, while not as commonly used as other data presentations, is perhaps the best at showing the true state of the VFD diode bridge regardless of incoming voltage quality.
