What Is Burst?
The Canvass “Burst” feature allows the Canvass user to request and receive near-real-time voltage, current, and power readings in a web browser. Burst is supported by many PMI devices, including the Boomerang, Javelin, Revolution, and Eclipse. The “Burst” feature has been available in Canvass since its inception, and may be launched for any device in Canvass by clicking the device in the list, and then clicking the “Burst” button in the “Actions” column of the device’s menu window.
How It Works
When one clicks the “Burst” button in Canvass, a request is sent from the browser to PMI’s Canvass servers, where it is then relayed to the field device via cell or Ethernet network. The browser then begins actively listening for real-time data readings from Canvass. The device, upon receiving the burst request, begins sending real-time readings to PMI’s servers. These readings are then read, formatted, and displayed by your browser within Canvass. Burst sessions last for approximately 90 seconds.
What Is MultiBurst?
MultiBurst is a feature of Canvass which provides a secondary user interface for easily “bursting”, or requesting and receiving real-time data from multiple devices at the same time. This allows for quick, straightforward comparison of real-time values from devices connected at various points in a given system. This is especially useful when working with multiple devices on a single feeder or system. For example, a substation monitor, several end of line feeder monitors, and monitors just past feeder power factor capacitors can provide a complete real-time voltage picture.
How to Use MultiBurst
The MultiBurst feature is available to all users with a Canvass account.
Accessing MultiBurst
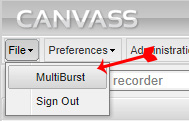
To access the MultiBurst feature, sign into Canvass using your credentials (https://canvass.powermonitors.com). In the top menu, click File and then click MultiBurst. This will open the MultiBurst feature in a new tab (See Figure 1).
NOTE: You must be signed in to use the MultiBurst feature. Attempting to access the MultiBurst feature without being signed in will redirect you to the Canvass sign-in screen.
MultiBurst Layout
The MultiBurst layout features two primary sections, the Device List, and the Burst Data View. The Device List appears as a sidebar along the left of the browser window, and the Burst Data View fills the remaining space on the screen at the right of the Device List.
Device List
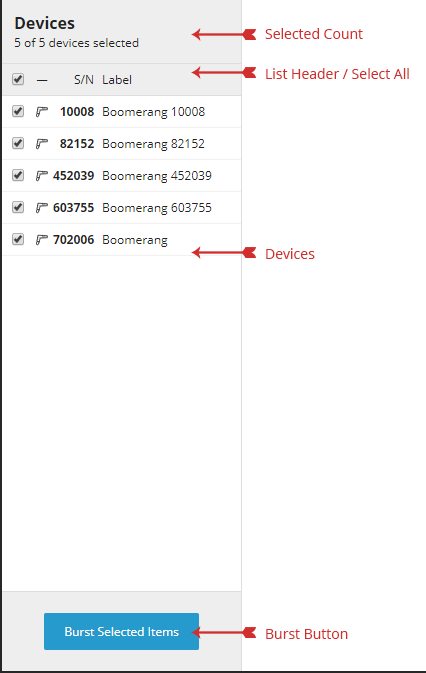
The Device List shows all available devices in your Canvass account and allows you to select one or more devices to “burst”, allowing you to view real-time data from these devices. At the top of the Device List is the “selected count”, which shows you the number of devices selected in the list, e.g. “3 of 16 devices selected.” Below the selected count is the list header, which provides names for the list columns, and the “Select All” checkbox feature. Clicking the “Select All” checkbox will select and subsequently deselect all devices in your account. The “Devices” list displays your account’s devices as serial number, and device label (if set). The “Burst Button” allows you to begin bursting data from the selected devices. You must select at least one device before you can click the Burst Button.
A device that is currently being “bursted” will display a vertical blue line at its right edge within the Device List. Devices that have experienced a burst error will have a vertical red line here.
In case of an error, look for device error details in the Burst Data View.
NOTE: Devices that are not active in the system are disabled. Disabled devices cannot be selected for “bursting”, even using the “Select All” checkbox feature. Disabled devices will appear grayed out in the Device List.
Burst Data View
The Burst Data View is where you will view burst data from selected devices. The Burst Data View header displays the bursting device count, which shows the current number of devices being bursted, the view mode selector, which allows you to toggle between List View and Grid View, and the Cancel button, which allows you to cancel all device bursting.
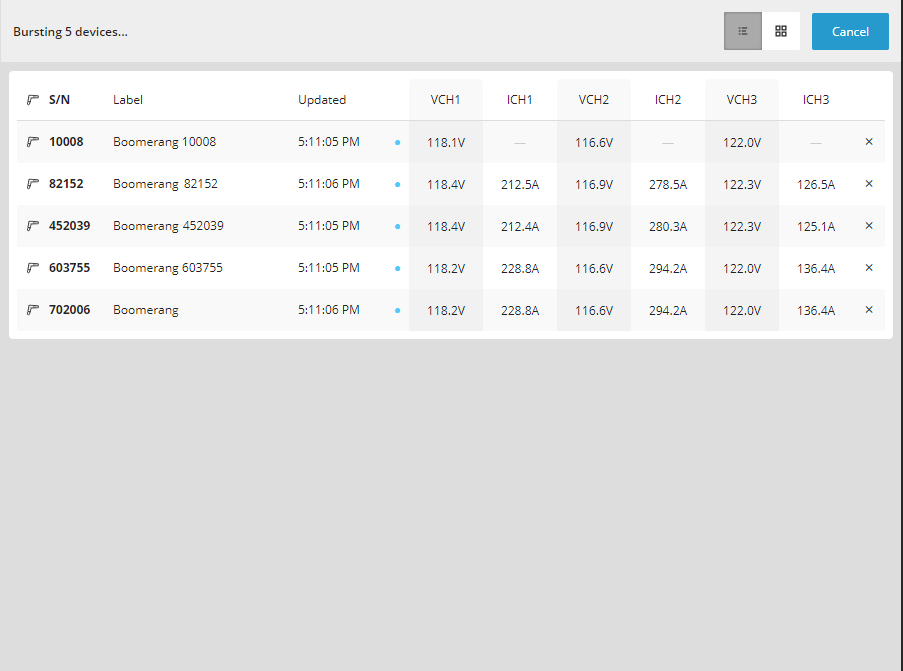
The List View for burst data displays burst data as a table, with columns for each channel and measure of data being received from all devices, with columns grouped by measure. The List View will display each bursting device as a row containing the device’s serial number, updated timestamp, and either burst status or latest readings.
For wider screens, the elapsed time (e.g. “4 minutes ago”) will be displayed to the right of the Updated timestamp, indicating how much time has elapsed since receiving burst data for that particular device. Burst errors will be displayed in red text, bookended by vertical red bars.
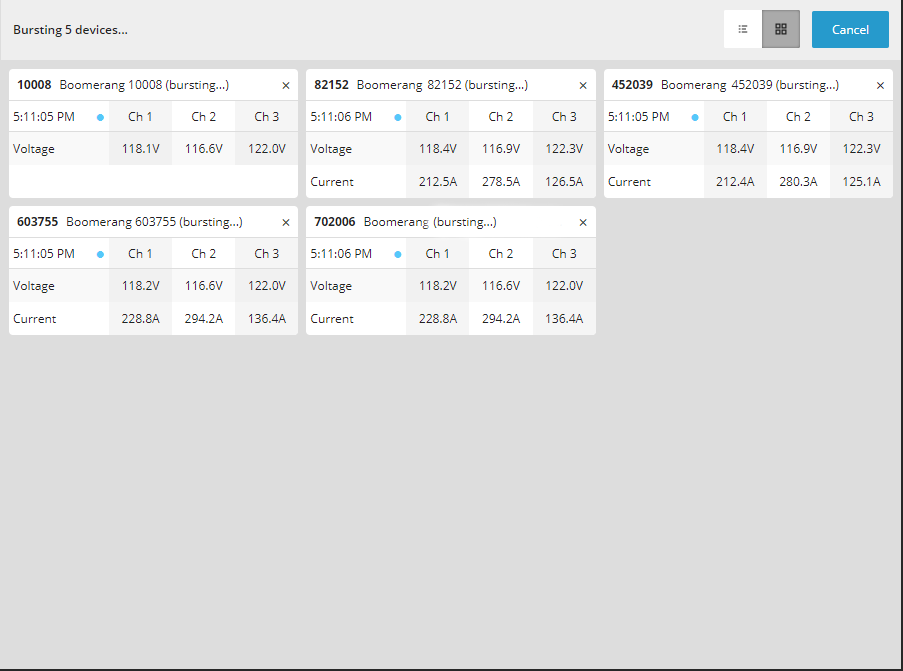
The Grid View for burst data displays data for each device as a distinct component, with columns representing channels, and rows representing measures. The device’s serial number, label, and burst status will appear in each component’s header, and the updated timestamp can be seen in the left-most column header, above the measure names. Burst errors will appear in red text, bookended by vertical red bars.
Practical Application
Multiburst is most useful when a related group of devices are selected. One application is making manual adjustments to voltage regulators. A multiburst time of 30 minutes may be used, with a device at the substation and several end of line monitors. Multi-bursting these devices provides a real-time view of RMS voltages throughout the feeder while tap changes are made.
Another application involves transmission change, e.g. switching sources or voltage adjustments. Multi-bursting multiple substations allows for a real-time overview of voltage over the entire region fed from transmission on one screen.
Conclusion
MultiBurst is a powerful new tool, enabling users to expand their RMS voltage view over a feeder, substation, or entire region. With strategic placement of Boomerangs, multiburst can be used to provide real-time feedback on operator changes, effects from upstream events, and even storm or other real-time disruptions.
