Abstract
The IEEE 519-2014 standard specifies measurements, analysis methods and limits for harmonic voltage and current. The 2014 version is very rigorous with multiple sets of limits, time intervals, statistical groupings, and recording lengths required for a full analysis. The Revolution PQ recorder coupled with ProVision PC software provides a solution that generates a full IEEE 519 compliance report with a single data recording and just a few mouse clicks. Instructions are provided here to easily generate IEEE 519 reports from Revolution data.

Brief Review of IEEE 519-2014
The IEEE 519-2014 standard gives limits for voltage and current harmonic distortion. The voltage distortion is the responsibility of the utility, while end-users are responsible for excess current distortion. The voltage and current thresholds are designed such that compliant load distortion coupled with reasonable utility source impedance will result in compliant voltage distortion for all customers.
The standard is not an equipment standard or meant for application at transmission or other locations that don’t directly serve end users. It’s also not meant specifically for generation, although there is a provision for generation thresholds. It calls for measurement at the “Point of Common Coupling” (PCC), defined as the
“Point on a public power supply system, electrically nearest to a particular load, at which other loads are, or could be, connected. The PCC is a point located upstream of the considered installation.”
The PCC is typically on the transformer primary for 3 phase customers or may be the secondary for residential customers. In most cases, recording on the secondary is more practical and also allows for monitoring customer load current. In general voltage harmonics are slightly higher on the secondary side, making it a conservative monitoring location choice. If voltage thresholds are met on the secondary side, they are likely in compliance on the primary.
Voltage distortion is limited for each harmonic and also for Total Harmonic Distortion (THD). There are four sets of limits, depending on the nominal PCC voltage.
Current distortion also has individual harmonic limits as well as total distortion. These values are scaled by the “Max Demand Current” (IL), defined as the
“sum of the currents at PCC, corresponding to the max demand during each of the 12 previous months, divided by 12.”
This is an average “max demand” current. Metering data may be available to estimate the max demand over 12 months.
Harmonics are scaled to IL, and the scaled total distortion is the Total Demand Distortion (TDD). The short circuit current, ISC, at the PCC is also needed. The ratio of ISC/IL determines the specific set of current distortion thresholds used (along with bus voltage).
The philosophy of IEEE 519-2014 is that if customers adhere to the current distortion limits, it’s practical for the utility to meet the voltage limits. If current distortion is too high, a utility may not be able to lower the system impedance enough to meet the voltage limits. Thus, a utility must monitor both customer load currents and their own voltage distortion, lowering the system impedances and detuning resonances on the distribution network while requiring high distortion customers to mitigate harmonics to acceptable levels.
Recording the Data
IEEE 519-2014 requires harmonic data to the 50th on two timescales – 3 seconds (“very short time”) and 10 minutes (“short time”). The recording period for the 3 second readings must be at least one day, and for 10 minutes, one week. To gather all required data in one recording, use the 3 second interval for an entire week. ProVision will use the 3 second data to create daily reports and compute 10 minute values automatically for the 1 week report.
Connect the Revolution at the PCC. Theoretically this may be the transformer primary. If so, it’s suggested to either monitor at an unloaded/lightly loaded transformer secondary or set of PTs nearby, or monitor on the customer secondary, keeping in mind that actual primary-side voltage harmonics may be less than those recorded. Monitoring on the secondary is a conservative approach – if voltage harmonics are in compliance there, the primary values should also be in compliance. The standard specifies measurements from each phase to neutral, so connect the recorder as a wye.
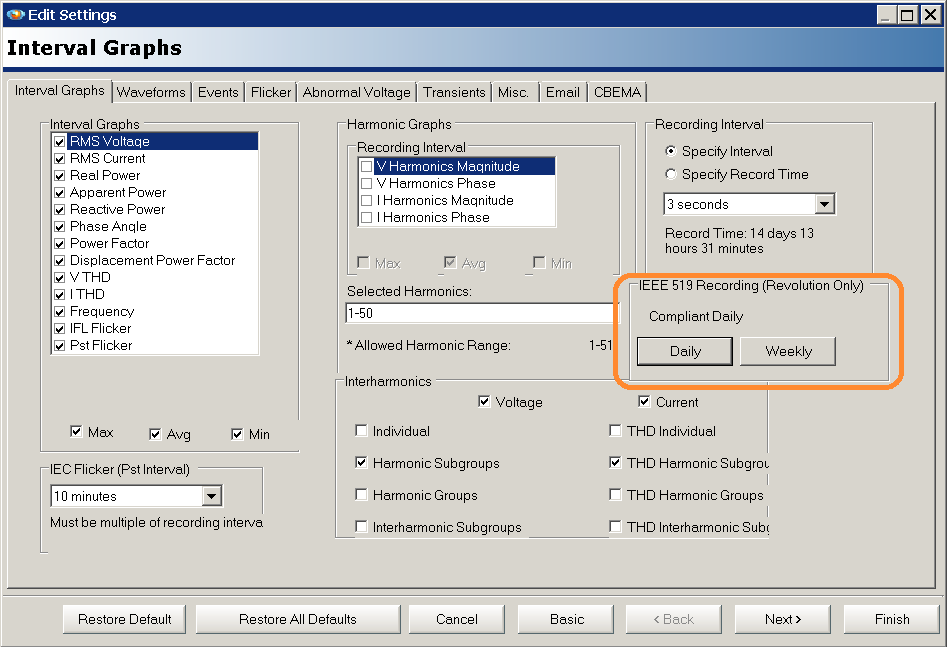
The IEEE 519 recording setup is generated automatically by clicking Daily or Weekly in the IEEE 519 section, as shown in Figure 2. Choosing Daily will select the 3 second stripchart interval and all required harmonics necessary to compute the 519 statistics. With a 512MB or larger memory size in a Revolution, the 3 second interval can be used with a week long recording. With this data, ProVision computes the 10 minute values required by IEEE 519, eliminating the need for two recordings.
Running the 519 Report
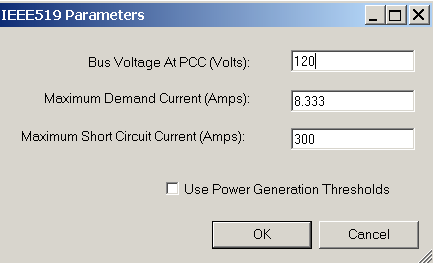
ProVision needs three additional inputs to compute the correct 519 thresholds for voltage and current: bus voltage, max demand current and short circuit current. All these parameters should be scaled to the same location; e.g. primary side voltage and current or secondary side voltage and current. If voltage or current scale factors have been entered for the entire data file, the values for bus voltage, max demand current and short circuit current should also be referenced to that same scale.
ProVision will prompt for these values (Figure 3) each time a report is run, with the previous values loaded in the form. These values are saved with the data file. If the load is mostly generation, check the “Use Power Generation Thresholds,” which selects the correct current parameters.
There are three reports available under Report, IEEE 519 Compliance: Summary, Daily 99%, Weekly 99% and Weekly 95%. Each of the reports begins with the standard ProVision header information, then the 519-specific parameters. With each of these reports, ProVision automatically computes the applicable voltage and current thresholds from the 519 tables (including multipliers), current TDD (Total Demand Distortion) and the harmonic percentiles.
If 3 second interval data is recorded, ProVision uses this directly to compute daily percentiles for each day of recording, and also to compute 10 minute values for the weekly thresholds. If other stripchart intervals are used, ProVision will compute the closest values possible. For example, with 1 minute data, ProVision can still generate 10 minute readings, but the 3 second daily values will use the slower 1 minute readings. The 519 statistics are only computed for channels 1, 2 and 3.
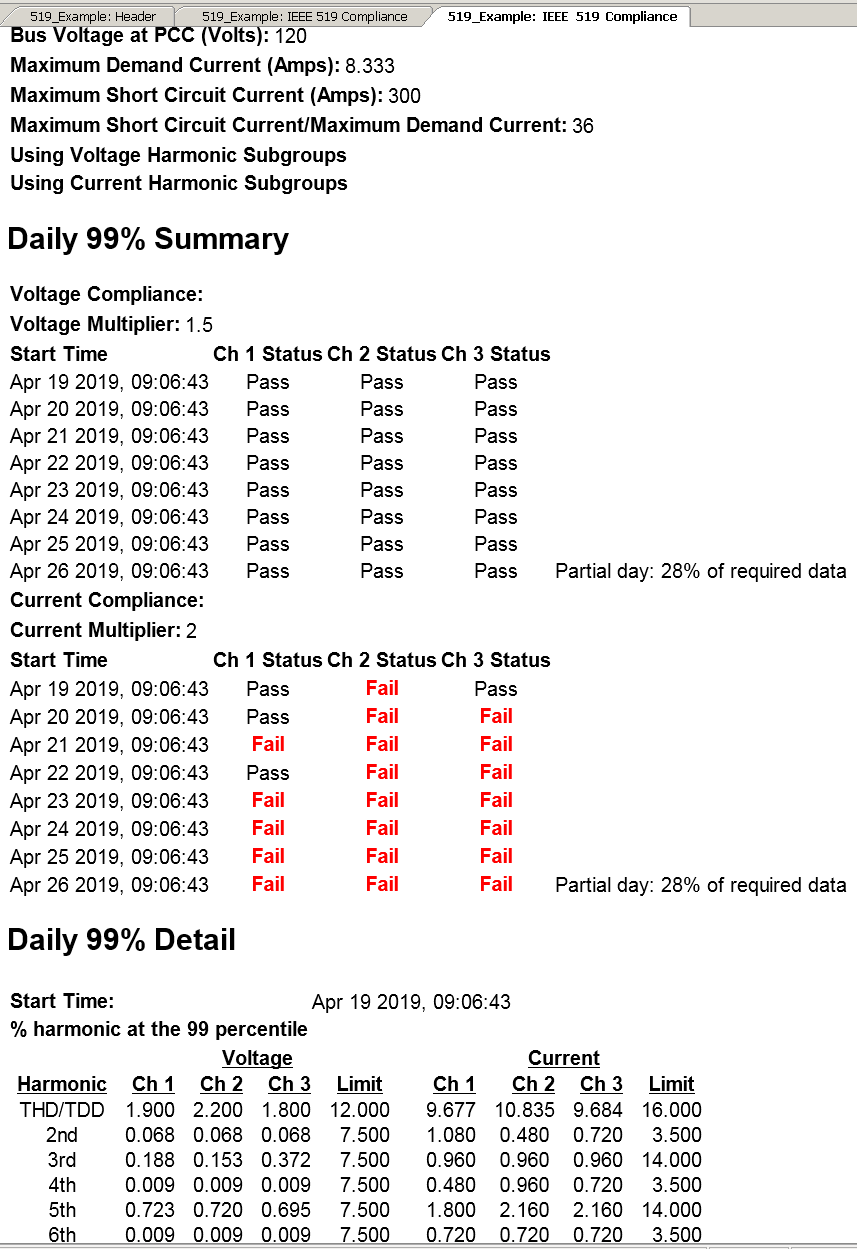
The Daily 99% report is computed from the 3 second harmonic data. The 519 standard gives threshold based on the 99% percentile over a 24 hour period. Each day of the recording is analyzed separately, with a pass/fail for each data. A summary of each day appears at the top of the report, followed by a detailed breakdown for each harmonic including the threshold used (Figure 4). Partial days are still analyzed with a note stating the amount of data included.
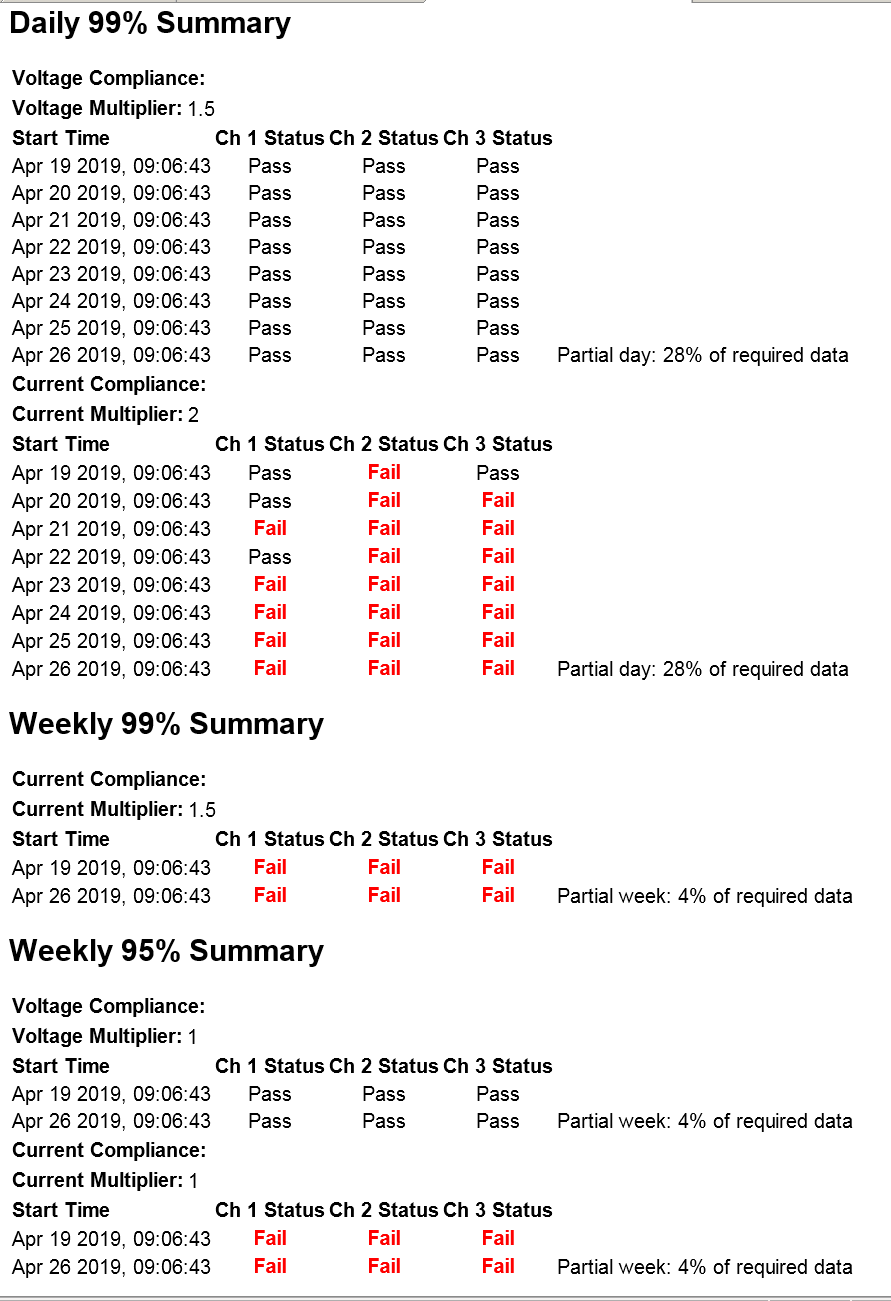
Similarly, the Weekly 99% and Weekly 95% reports use the 10 minute values, with a summary showing each week’s pass/fail status at the top, along with the details for each harmonic.
The Summary report shows the header results for the Daily and both Weekly reports, without the details on each harmonic or the thresholds used. For the details on a failed status, use the Daily or Weekly reports to see which specific harmonic or THD/TDD caused the failure.
The short circuit and max demand current are key parameters in determining customer 519 compliance. Current harmonics are scaled directly by the max demand current and the thresholds vary based on both parameters. In some cases, a range of max demand currents may be estimated or for planning purposes, a larger max demand current explored. The 519 report may be re-run as often as needed to explore how sensitive the pass/fail status is to changes in both parameters. This can be used as a tool for customer expansion or transformer upgrades.
Conclusion
A full 519 analysis can be time consuming by hand due to the multiple data sets required, percentile computation over multiple time periods and threshold multipliers and tables that vary based on circuit parameters. ProVision’s 519 report performs all these computations given a single week-long Revolution recording, greatly simplifying the analysis. The ease of generation makes it practical to use the report as a what-if tool, to explore how sensitive a situation is to key parameters such as max demand or short circuit current.
