Abstract
This an overview of what the GE Flicker Curve is, how, why and when it was developed, and who developed it. Also, this paper covers some of the more useful applications of the GE Flicker Curve and discusses some of the common sources of how flicker is generated, and how it can be introduced into a power distribution system. Most PMI power quality analyzers have the ability to measure IEEE 141, the GE Flicker Curve along with some of the more recently developed flicker standards.
Defining Flicker
When most people or power consumers refer to flicker, it is usually in reference to an inconstant or wavering light. A more precise definition of lamp flicker quoted from the IEC technical vocabulary is, “The impression of unsteadiness of visual sensation induced by a light stimulus whose luminance or spectral distribution fluctuated with time”. Perceiving excessive flicker involves the eyes and the brain, and if it continues for a long enough time, it can be very irritating and annoying to a customer. The point at which flicker becomes irritating or even perceivable varies person to person and can depend on many factors. Some of these factors include a person’s age, neurological, psychological and overall health, and the individual’s critical flicker frequency. Critical flicker frequency (CFF) also referred to as flicker-fusion occurs within a range of about 5 to 50 Hz. Under normal steady state power conditions most people would observe an incandescent light bulb to be emitting perfectly steady light as if the power source was DC even on a 60 or 50 Hz system. The CCF gradually decreases with age in adults; however, there are some differences from person to person even at the same age. Some humans can perceive visible changes in light output with as little as 0.25% changes in the RMS voltage that powers the light source.
To summarize, some people are more sensitive to flicker than others, so flicker is very subjective and heavily dependent upon human perception. As with most human traits, there is a bell curve-type response with the norm being toward the center of that curve. The GE Flicker Curve was based on the norm and not the extremes of human perception of flicker.
GE Flicker Curve, or IEEE 141
GE Flicker Curve, or IEEE 141, is one of the oldest and most common flicker reference curves. It was developed by General Electric in 1930. This curve is based on testing that GE did on several utilities and was originally referred to as GET-1008L and then republished in the IEEE Red Book as the IEEE Standard 141-1993. The GE Flicker Curve shows two curves, the threshold of perception and a threshold of irritation. The GE Flicker curve is based on square-wave changes to voltages at the frequencies indicated on the graph. When the load is changed in a more gradual fashion than in a voltage step such as a square wave, the flicker is much less noticeable. Human eye-brain response is much more sensitive to a rapid change in light intensity than slow changes in light intensity.
The GE Flicker Curve is based on the number of dips per minute, second or hour. The change of apparent light intensity varies with the type of light being used. In smaller incandescent bulbs, the filament thermal mass is lower than in larger incandescent lights. This causes the filaments to change temperature more rapidly, thus photon output and light frequency or color in these bulbs makes flicker more noticeable for the same change in voltage and duration. In general, fluorescent lights flicker less for a given amount of voltage input change than incandescent, unless the input voltage approaches their voltage turn on threshold. This can also vary with the thermal temperature of the fluorescent lamp and the age of the tube. As you will note, the GE Flicker Curve is represented by the percent of voltage dip on the vertical axis versus the frequency of dips on the horizontal axis. This graph does not indicate changes in luminosity directly but is correlated to a standard change in light output with a change in voltage.
PMI’s recorders default to the threshold of irritation curve from the above IEEE Standard 141 shown in the top curve in Figure 1. This curve was generated to show voltage flicker that humans perceive to be irritating. When this level of voltage fluctuation occurs, a flicker event is recorded with the flicker time and magnitude. The allowable voltage threshold and a limit on their quantity in a certain time span for the default setting in ProVision is taken directly from the GE Flicker Curve, conforming to IEEE Standard 141. Since the GE Flicker Curve is somewhat subjective, sometimes it may be beneficial for a specific test to have values other than the typical borderline of irritation curve. In this case the defaults can be easily altered in ProVision by the operator.
In PMI recorders, flicker is computed once per second, based on the previous second’s one cycle maximum, minimum, and one-second average RMS voltage levels. The thresholds are given as a percentage. If the minimum, maximum, or the average varies from one another by more than the percentage for a certain time period, then a flicker event is incremented. Also, if the counter value exceeds the limit for a certain time period, a flicker event is triggered.
In ProVision, when a report is created, the date and time are recorded along with the number of voltage events that exceed the preset tolerance. The time span over which the flicker occurred is also recorded and each channel is reported separately.
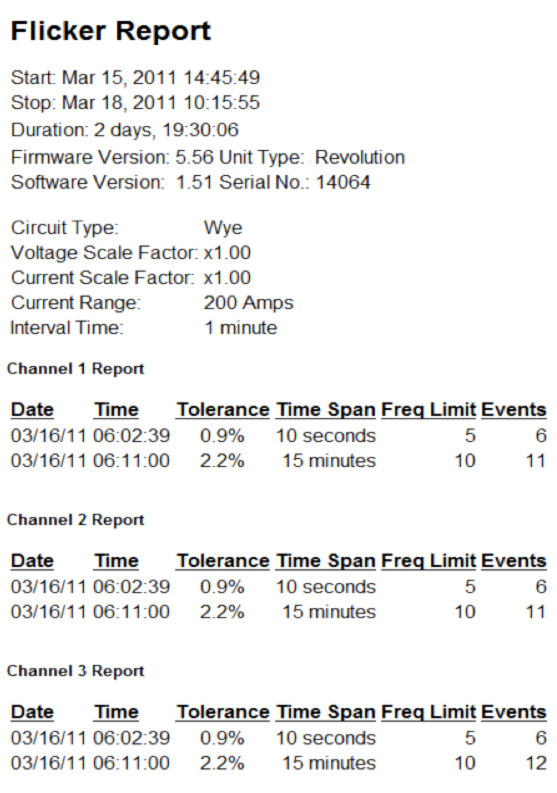
ProVision’s Flicker report (Figure 2) is specially designed to show a utility customer if a voltage variation situation exists that would be perceived as flicker in lighting. The trigger default in ProVision is based the perceived borderline of irritation part of the GE Flicker Curve, IEEE Standard 141.
Flicker Causes
Flicker’s root cause is a voltage fluctuation of the line voltage driving the light source. The primary cause of voltage fluctuations is due to the time variability of the reactive power component of a fluctuating load. Some of the major offenders are arc welders, arc furnaces, starting of large induction motors, capacitor switching, on-load transformer tap changers, loose resistive connections, or any other device that can change the load on the line in a very short amount of time. This also includes anything that may cause a situation where inter-harmonic voltages can be superimposed on the light’s voltage supply line.
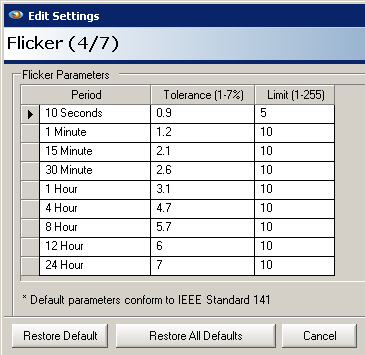
The graph in Figure 3 shows the PMI default curve in blue superimposed onto the Standard IEEE 141 GE Flicker Curve. As you can see, the blue curve comes extremely close to matching the red curve, which is the Borderline of Irritation Curve. The difference between the two curves is due to the tenth percent resolution in the ProVision flicker settings. Flicker settings in ProVision are shown in Figure 4.
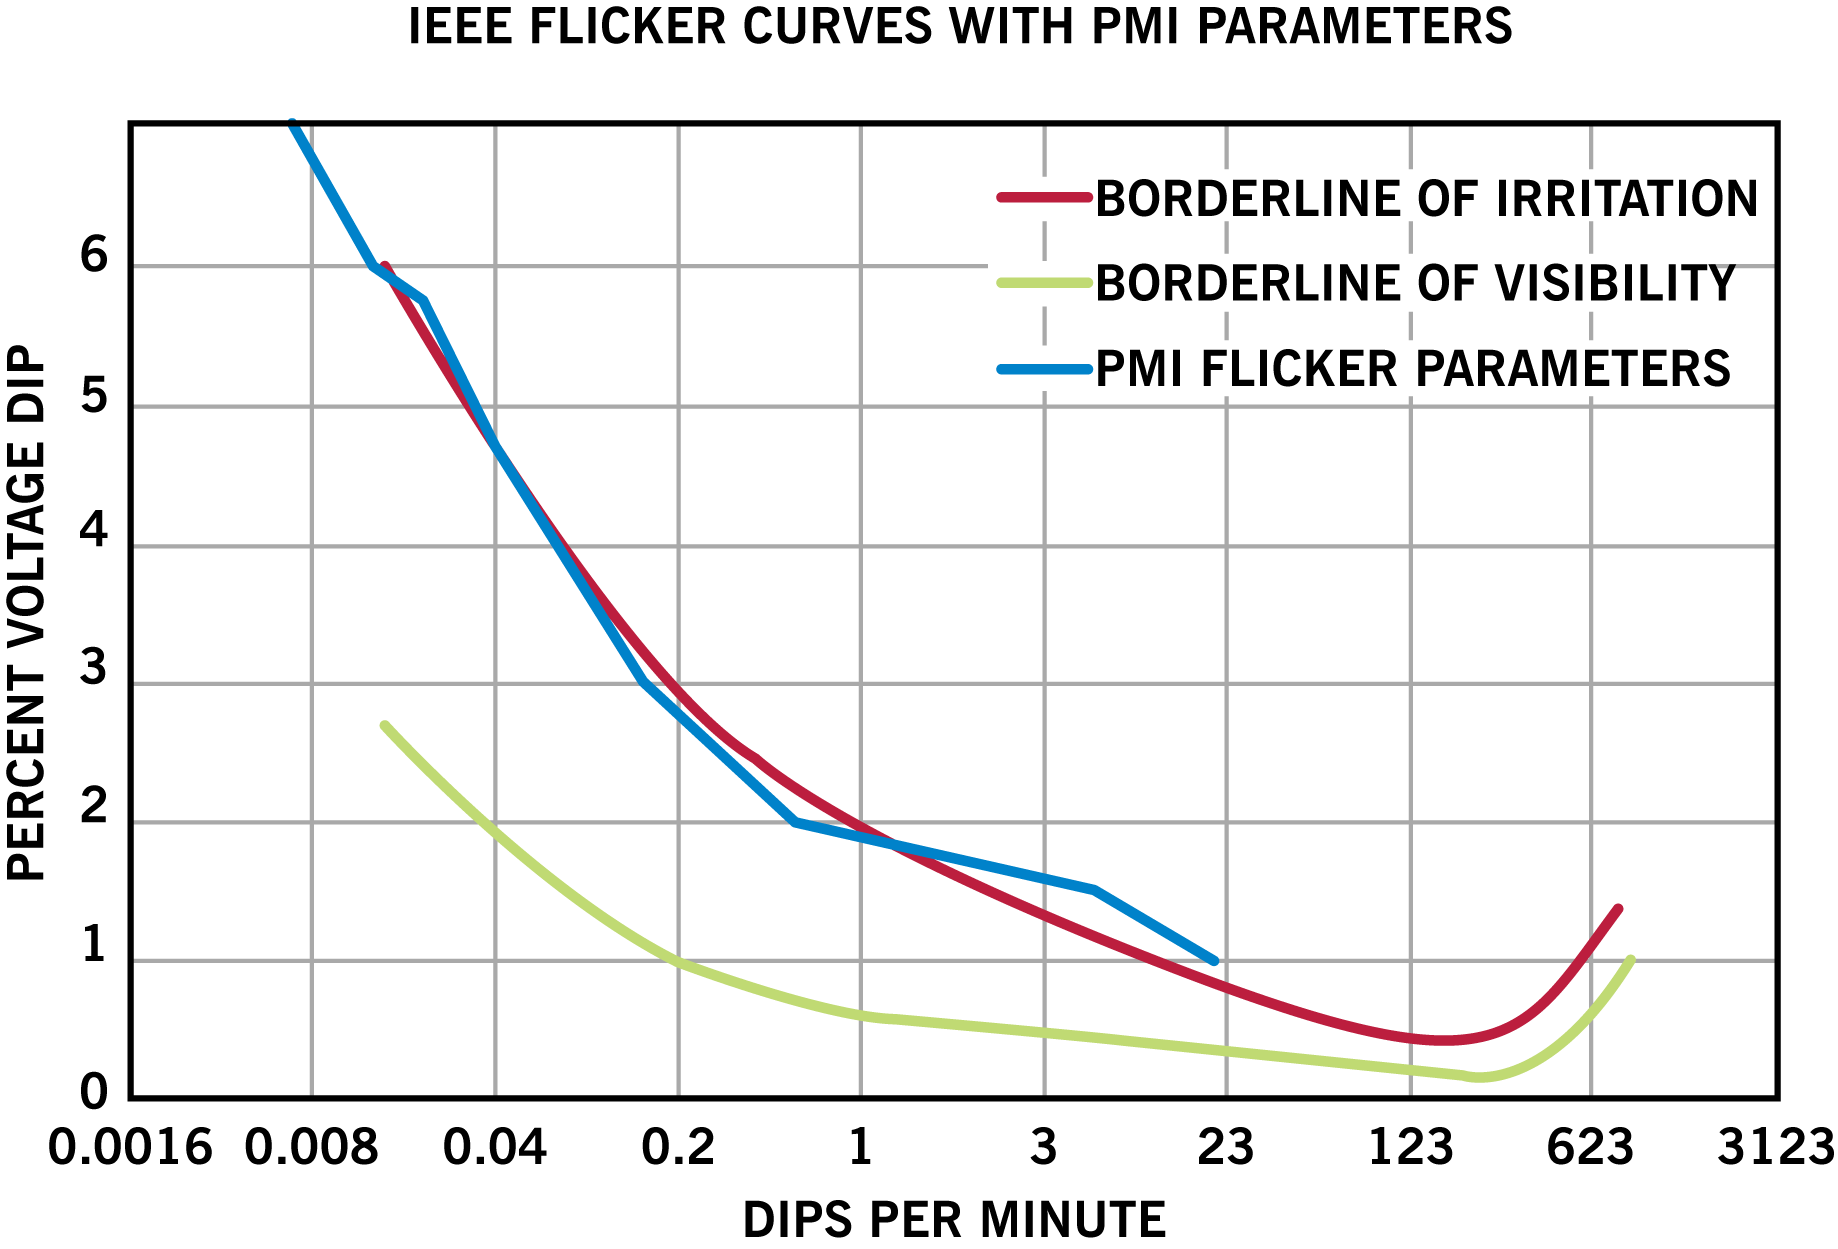
As an example to show how the ProVision settings relate to the flicker curve, consider the 1 Minute setting. In Figure 4, the 1 Minute tolerance is 1.2%, and the limit is 10. This sets a trigger such that if more than 10 voltage excursions exceeding 1.2% occur in a sliding 1 minute window, a flicker event will be logged by the recorder. Ten dips in a 1 minute period equates to 10 dips per minute. Looking at the logarithmic x-axis on Figure 3 at roughly where 10 dips per minute falls, the blue PMI curve should be at 1.2%. Similarly, for 10 dips per hour (the “1 Hour” row in Figure 4), the settings are 3.1% and 10 dips per hour. Ten dips per hour is 0.167 dips per minute, and the blue PMI curve should be at 3.1% in Figure 3. The different flicker periods in Figure 3 overlap and are cumulative – that is, a 5% sag could count as an event all the periods where the threshold is under 5%, if the timing of the sag causes any specific period to exceed its sag limit.
Conclusion
The GE Flicker developed by General Electric in the 1930’s is one of the oldest and most common flicker standards used today. The GE Flicker Curve is based on studies done on a correlation of human perception of light flicker in reference to voltage fluctuation over time. All current PMI recorders have the capability of generating Flicker Reports and use the GE Flicker Curve as bases for the default trigger settings. Some of PMI recorders are also setup to record other more recent flicker standards.
Since light flicker is very subjective, a utility customer can always modify the recorder’s Flicker Report settings to be more or less sensitive than the default GE Flicker Curve. The PMI Recorder’s GE Flicker Report is a very useful tool for documenting and tracking down the cause of voltage fluctuations that create annoying light flicker to utility customers.
