Abstract
ProVision offers many different graphing options, which allow different types of power quality data to be presented for examination and analysis. In addition to presenting the graph, ProVision also includes features in which user-defined annotations can be added to the graph. These annotations can be used to draw attention to certain portions of the graph, or explain any potential anomalies. This whitepaper serves as an overview and demonstration of how to add and manipulate annotations in ProVision.
Annotation Types
The different types of annotations are available on the ProVision toolbar, as shown in Figure 1.
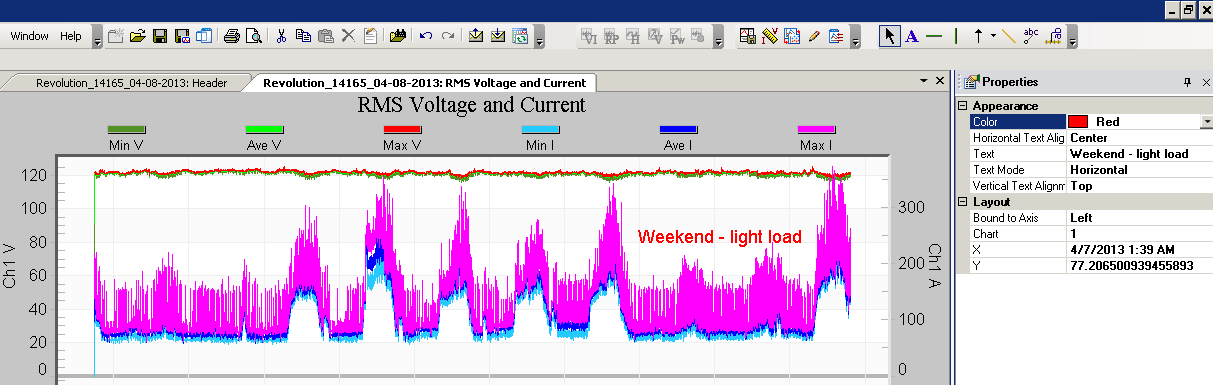
Each annotation has a different style and representation, and therefore some of the annotation types are more useful to bring emphasis to different types of data than others would be. Furthermore, each annotation has a different set of properties that correlate to it. These properties can be modified in the Properties Window, as shown in Figure 2.
To add an annotation, simply select the annotation type from the toolbar, then click the graph at the desired location to insert it. The currently-selected annotation type on the toolbar will have a blue box outlining it. To stop adding annotations, or to access general graph navigation functions, select the Pointer option.
Text Annotation
The text annotation allows a text label to be added to the graph at any place. Text labels can be convenient to describe information about a channel or the graph as a whole, but without needing to draw attention to any one particular region of the graph. The properties of a text label that can be modified are the text color, the text itself, and whether the text should be oriented horizontally or vertically.
Horizontal Line Annotation
A horizontal line added to the graph can be used to delimit, for example, voltage and current thresholds, or as a way to add a custom graduation to the y-axis. The properties of a horizontal annotation are the color of the line, its style—such as a solid thin line, or a dashed thick line—and any custom text to describe the annotation. In addition, this text can be positioned either inside or outside the graph, along the y-axis, using the Text Placement property.
Vertical Line Annotation
A vertical line can be used to delimit the beginning and ends of events, such as outages, or as a way to add a custom graduation to the x-axis. The properties of a vertical line are the same as those of the horizontal line. However, the Text Placement field applies to the x-axis instead when positioning the text label.
Arrow Annotation
Arrow annotations are available in the cardinal and ordinal directions, and the specific direction of the arrow can be chosen by selecting it from the drop-down menu next to the button, as shown. Arrows can be used to point out explicit parts of a trace on the graph, such as a current spike. The properties available to arrows are the direction and color of the arrow, as well as an accompanying text label.
Line Annotation
The line annotation is a freeform line drawn between two points. Placing a line annotation requires clicking the graph once at the spot for the beginning of the line, and a second time at the spot where the line should end. This draws the line between the two points. Note that after placing the first point, the line tracks the mouse cursor. The properties of a line annotation include the color of the line and any accompanying text. Note that accompanying text will be displayed relative to the second point when constructing the line. Lines can be useful when wanting to draw attention to a range of data.
Pointer Annotation
A pointer annotation can be used to draw attention to an explicit part of the graph, much like an arrow annotation. However, the pointer annotation is placed free-form similar to a line annotation. This makes the pointer annotation useful in situations where it is only necessary to draw attention to what the pointer annotates, but where a direction would be superfluous. The properties of the pointer annotation are its color and the pointer text. The pointer text is placed at the second point specified, again similar to the line annotation.
Axis Annotation
The axis annotation places a vertical text label on the bottom-most part of the graph. This can be useful when needing to include an additional graduation along the x-axis without a vertical line annotation. By the same token, an axis annotation can be used in conjunction with a vertical line annotation.
Annotation Operations
Annotations can be moved by moving the mouse cursor over the annotation—the mouse cursor will change to the “Index Finger” appearance—and clicking and dragging the annotation to its desired location. Note that for arrows, horizontal and vertical lines, and free-form lines, the annotation element itself must be selected, and that the text component alone is insufficient. For free-form lines, either endpoint can be repositioned in this manner.
The position of an annotation is also reflected in the properties window as shown in Figure 2. When moving the annotation with the mouse, the X and Y coordinate properties update automatically. However, these values can be fine-tuned by modifying these fields directly, as well. Note that the valid values for the X coordinate are dependent on which axis the annotation is bound to. The bound axis can be changed by setting the “Bound to Axis” property. Doing so will cause the X coordinate to correlate with the scale along the corresponding bound axis.
For graphs with multiple charts, such as a multi-channel current graph, the chart the annotation appears on is specified via the Chart property. By changing this property, the chart the annotation appears on can be changed without modifying its location. This can be convenient when moving an annotation to another channel, but needing to maintain its appearance.
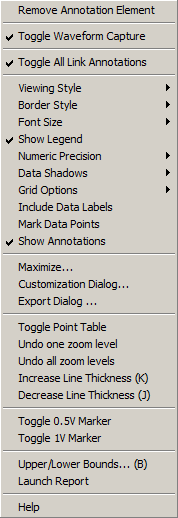
Annotations can also be removed by right-clicking the annotation with the mouse, and, from the resultant context menu as shown in Figure 3, selecting “Remove Annotation Element”. Note that deleting an annotation cannot be undone. However, to temporarily hide annotations, the visibility of annotations can be toggled via the “Show Annotations” context menu option. This affects all annotations.
Any number of annotations can be placed on a graph. Whenever a graph is closed, ProVision offers to save any modifications made to the graph. This includes the placement of annotations. Therefore, the annotations will persist on the graph between sessions, and the recording file containing the graph can be distributed and still contain the annotations.
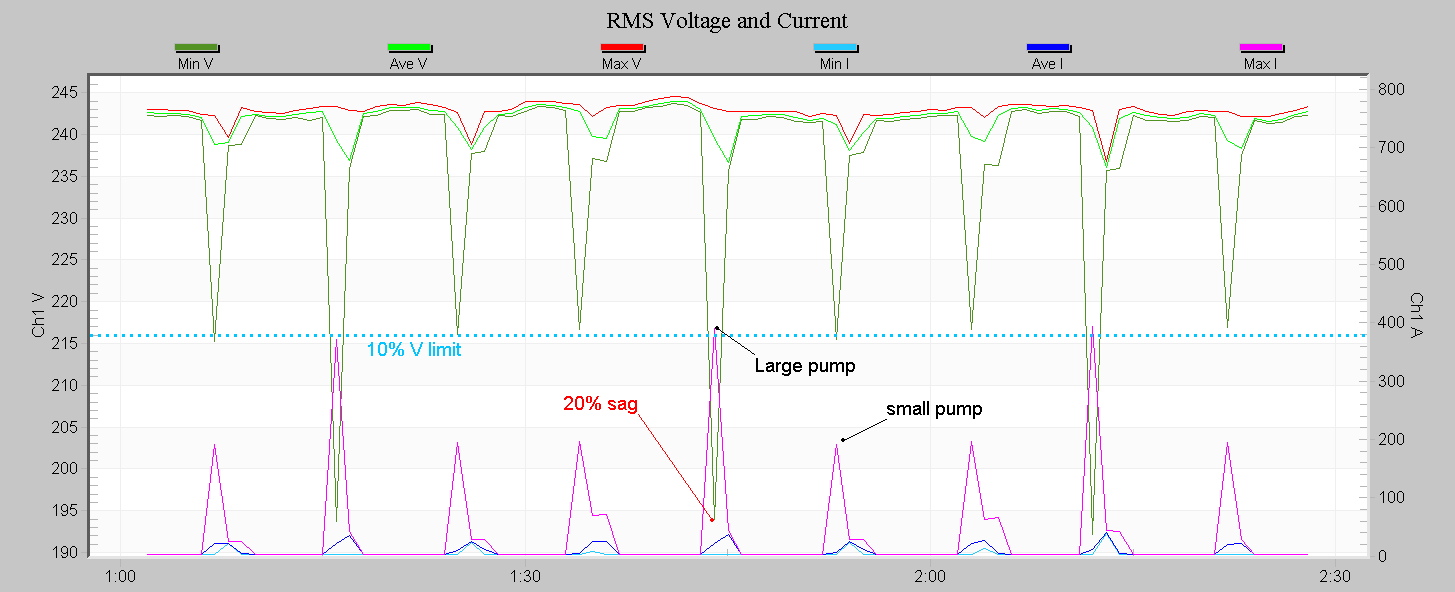
Figure 4 shows an annotated stripchart. This is a 240V system with two pumps, one large and one small. A horizontal line annotation has been added (blue dotted line) at 216V, marking a 10% low limit (also described with the “10% V limit” text annotation). The annotation positions are all in the same units as the data on the graph, so to place this horizontal line at exactly 216V, simply type “216” in the Properties panel for the Y location. A start-up of the large and small pump is marked with the pointer annotation type, and the 20% sag from the large pump is marked in red with another pointer annotation.
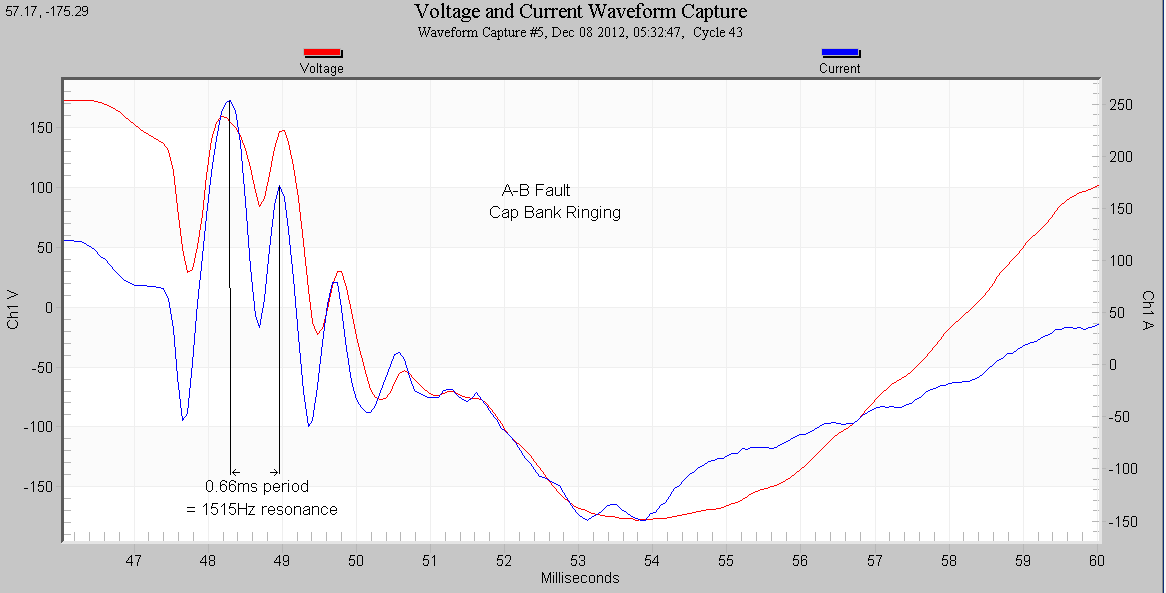
In Figure 5, we have a waveform capture showing a line-line fault which caused capacitor bank ringing. The resonant frequency was calculated by measuring one period of the ring waveform, and this is indicated by the two vertical line segment annotations, two arrows, and the text annotations. The precise X-Y values of the line segment endpoints can be edited in the Properties panel, and since the units are actual milliseconds and volts/amps, it’s easy to precisely place these at exact locations.
Automatic Annotations
Annotations are also automatically created as part of the recording process for voltage and current stripcharts. These annotations appear on the graph as small circles or as vertical line annotations, are dark yellow in color, and have special behavior when clicked. The circle annotations designate event changes, and when clicked, cause a new tab to open containing the correlating event report. The vertical line annotations designate waveform captures, and when clicked, open a new graph showing traces of the voltage and current at that point.
These automatic annotations cannot be moved or deleted from a recording. However, their visibility can be toggled via the “Toggle All Link Annotations” from the context menu. This can be useful when it is not necessary to display the link annotations. Note that if “Show Annotations” is set to hide, then the automatic annotations are not shown regardless of this setting.
Conclusion
Placing annotations can be useful when wanting to direct attention to specific regions of the graph, or when wanting to add additional information. Being able to do this in ProVision removes the convoluted process of exporting the graph to an image file, then editing that file directly using a third-party application. Furthermore, all the annotations are kept within the source recording, eliminating the need for multiple files. Being able to create and modify annotations is one of the many features in ProVision to assist with power quality data analysis.
