Abstract
This white paper provides an overview of how to find and analyze various aspects of voltage sags using ProVision and data captured using PMI’s recorders. For a given dataset, where Voltage and Current was recorded, voltage sags can be found and analyzed for depth, duration, and source using the functionality of ProVision. This white paper assumes the user is familiar with capturing, saving and loading data into ProVision and gives detailed steps on how to analyze voltage sags.
What Is a Voltage Sag?
A voltage sag is a reduction in RMS voltage (between 10 and 90 percent of nominal) that can last anywhere from 0.5 cycle up to 1 minute. Voltage sags are typically caused by loose connections, energizing a load that requires large current, or power system faults. For example, a motor’s starting current can be from 4x to 8x times the normal running current. When the motor is first energized, a voltage drop will occur in the building and distribution wiring lasting a few cycles. Since it is not practical to size transformers and wiring to completely eliminate current-caused voltage drops, transformers with lower ratings and smaller wiring are used to make costs practical.
Finding Voltage Sags Using Reports
There are two ways to find voltage sag events using ProVision, visually scan an RMS Voltage and Current graph for dips in the voltage or use the “Voltage Out of Bounds” feature found in the Report menu. The latter method is more efficient and tends to provide excellent results. For a given recording, ProVision will search and highlight each voltage event outside of the specified bounds. Use the following steps to access this feature:
- From the main menu choose (Report, Voltage Out of Limits) and a dialog box will appear.
- Set the lower limit voltage to 90% of the nominal value to find any sags. For 240 Volt nominal, use a lower limit of 240 Volts * 0.90 = 216 Volts.
- To prevent over voltage events from appearing in the report, set the upper limit threshold well above the nominal voltage. In this example, 300 Volts should prevent most over voltages from appearing.
- Select the “Min/Max Values” option to find the lowest/highest (peak) value observed during an interval. Otherwise, steady state values can be found by choosing the “Average Values” option.
- Click “OK” to generate the report.
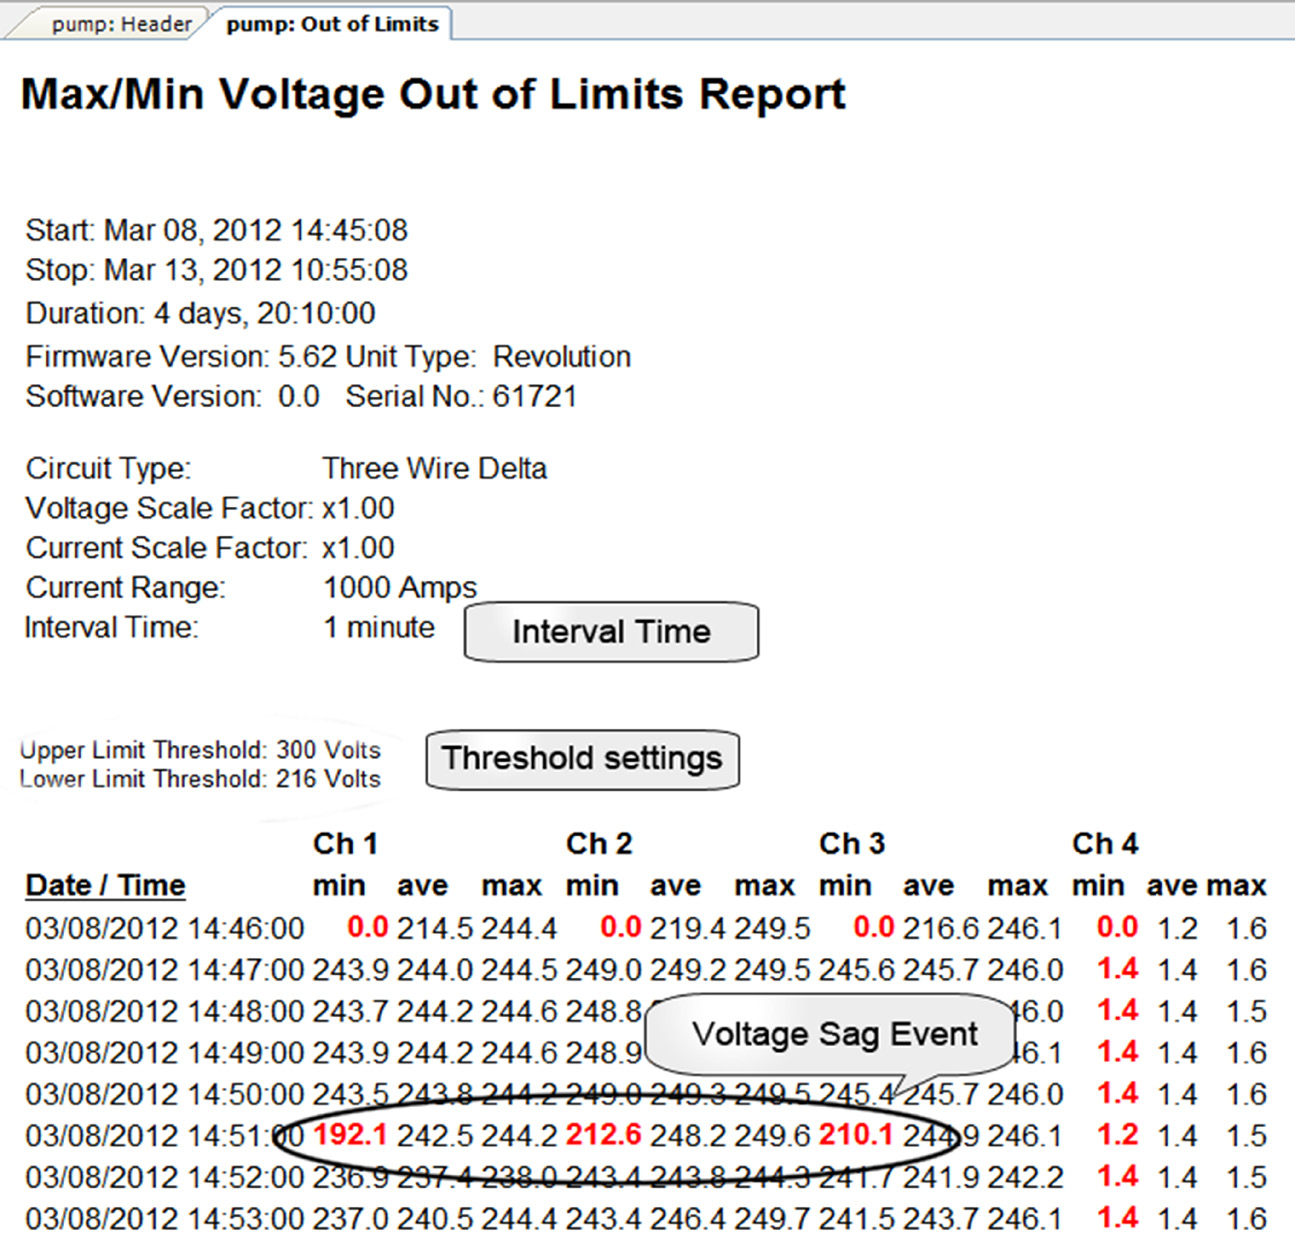
The header of the report will display the start/stop time and duration of the data along with the settings of the capture device (see Figure 1). An “Interval Time” is listed which indicates the time over which the collected data was averaged. During the interval only one minimum and one maximum value is displayed, which represents the absolute minimum and maximum for that time span.
In this case the interval was set to 1 minute during this recording and because we chose to use actual Min/Max Values (Step 4 above), the lowest value recorded during that interval is compared to the threshold setting. Each row in the report will have a highlighted value that is outside of the bounds. It is worthwhile to note that the time stamp in the out of limits report does not indicate that exact time at which the voltage sag event occurred, only that sometime during the interval that particular minimum was measured.
Viewing Voltage Sags
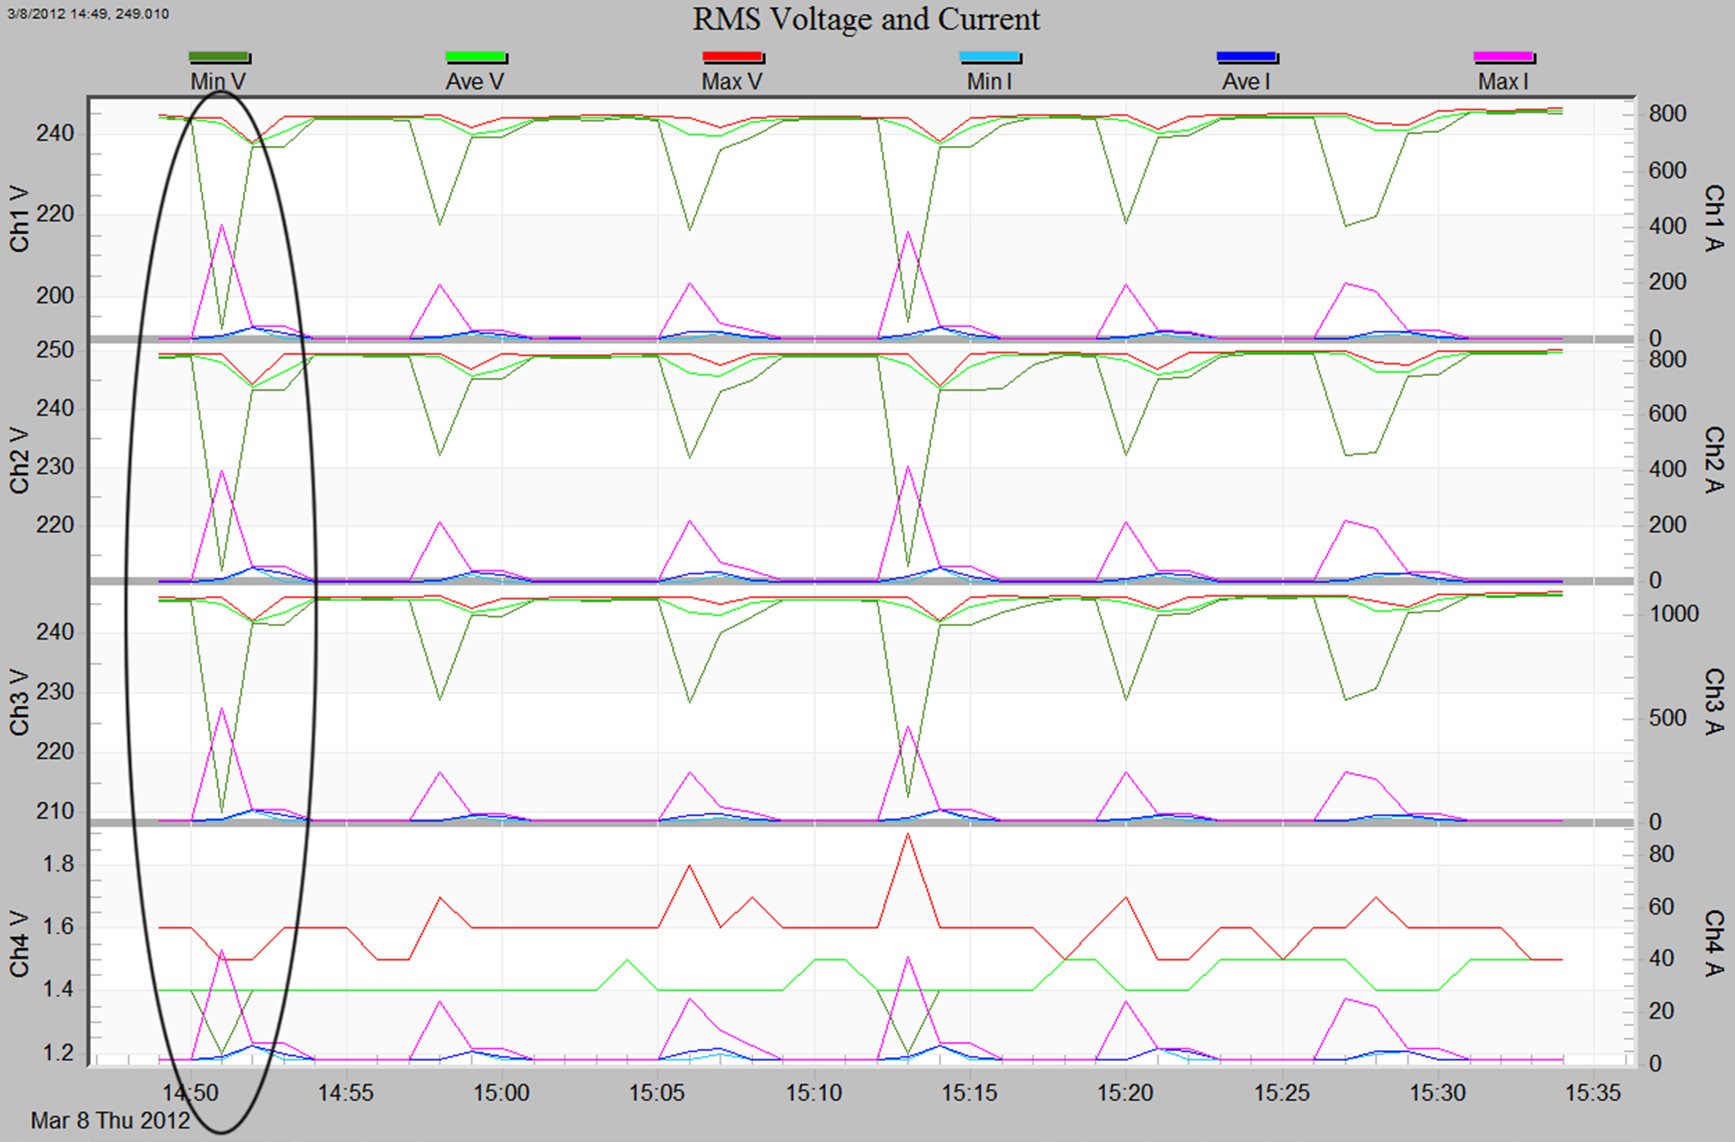
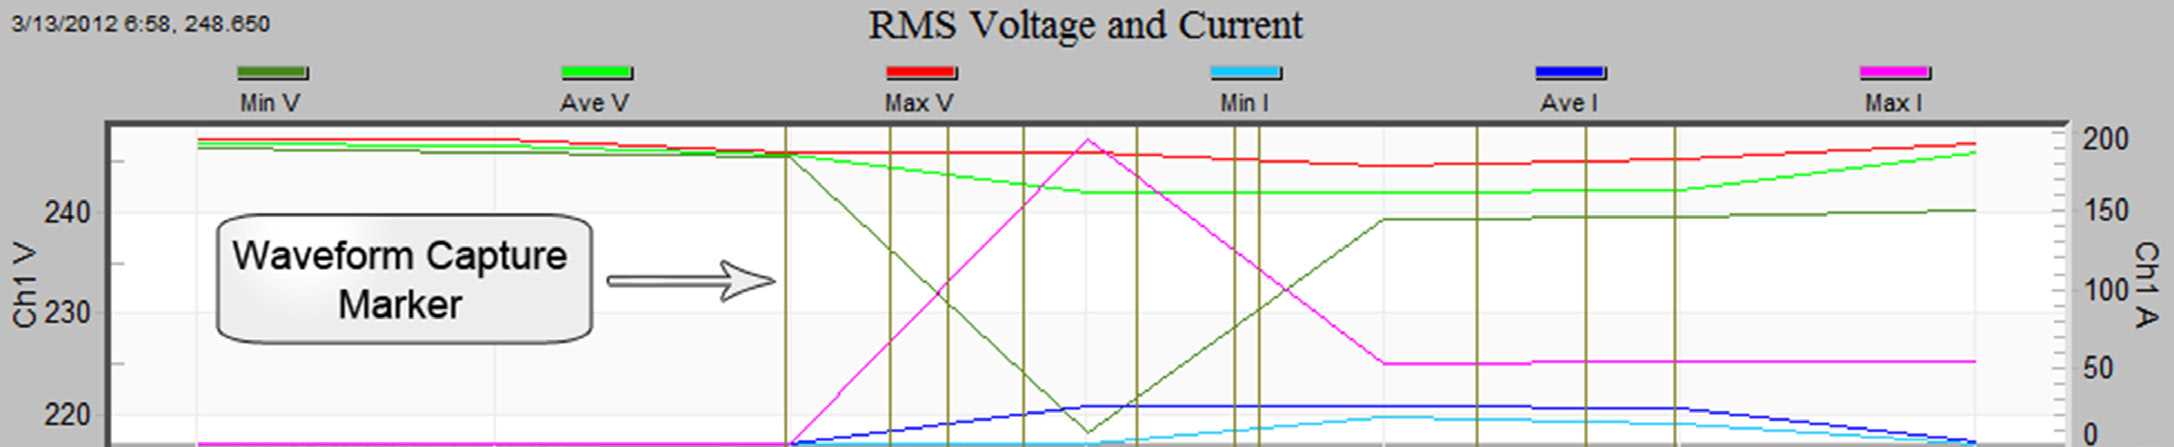
The date and time stamp provided in the previous report can now be used to locate the voltage sag in a graph. Since voltage sags are best understood when viewed in conjunction with current, they can be viewed together by choosing (Graphs > RMS Interval > RMS Voltage and Current) from the main menu. When first loaded, the graph will display the entire duration of the recorded data. Use the horizontal axis label to narrow down the range where the event occurred. Next, zoom in on the event by clicking and dragging the mouse over the desired region repeating the zoom process until the desired level of detail is achieved. (Figure 2). Voltage sags can also be viewed by using waveform captures for devices that support this feature. When viewing a RMS Voltage and Current stripchart, a vertical bar appearing at a given time will indicate a waveform capture. (Figure 3) Click on the vertical bar to open the waveform window where the sag can be explored in detail.
Determining the Depth of a Sag
To determine the depth of a sag, the minimum value of the sag must be obtained and compared to the nominal value for the circuit. When viewing the RMS Voltage and Current stripchart it is not easy to determine an actual value using visual inspection. ProVision allows inspection of captured data points when viewing an RMS Voltage and Current stripchart by pressing ‘t’ to enter the data point inspection mode (Figure 4). Use the mouse to click on the point of interest and all the values recorded for the interval are displayed in the box. Choose the min value for the Channel in question.
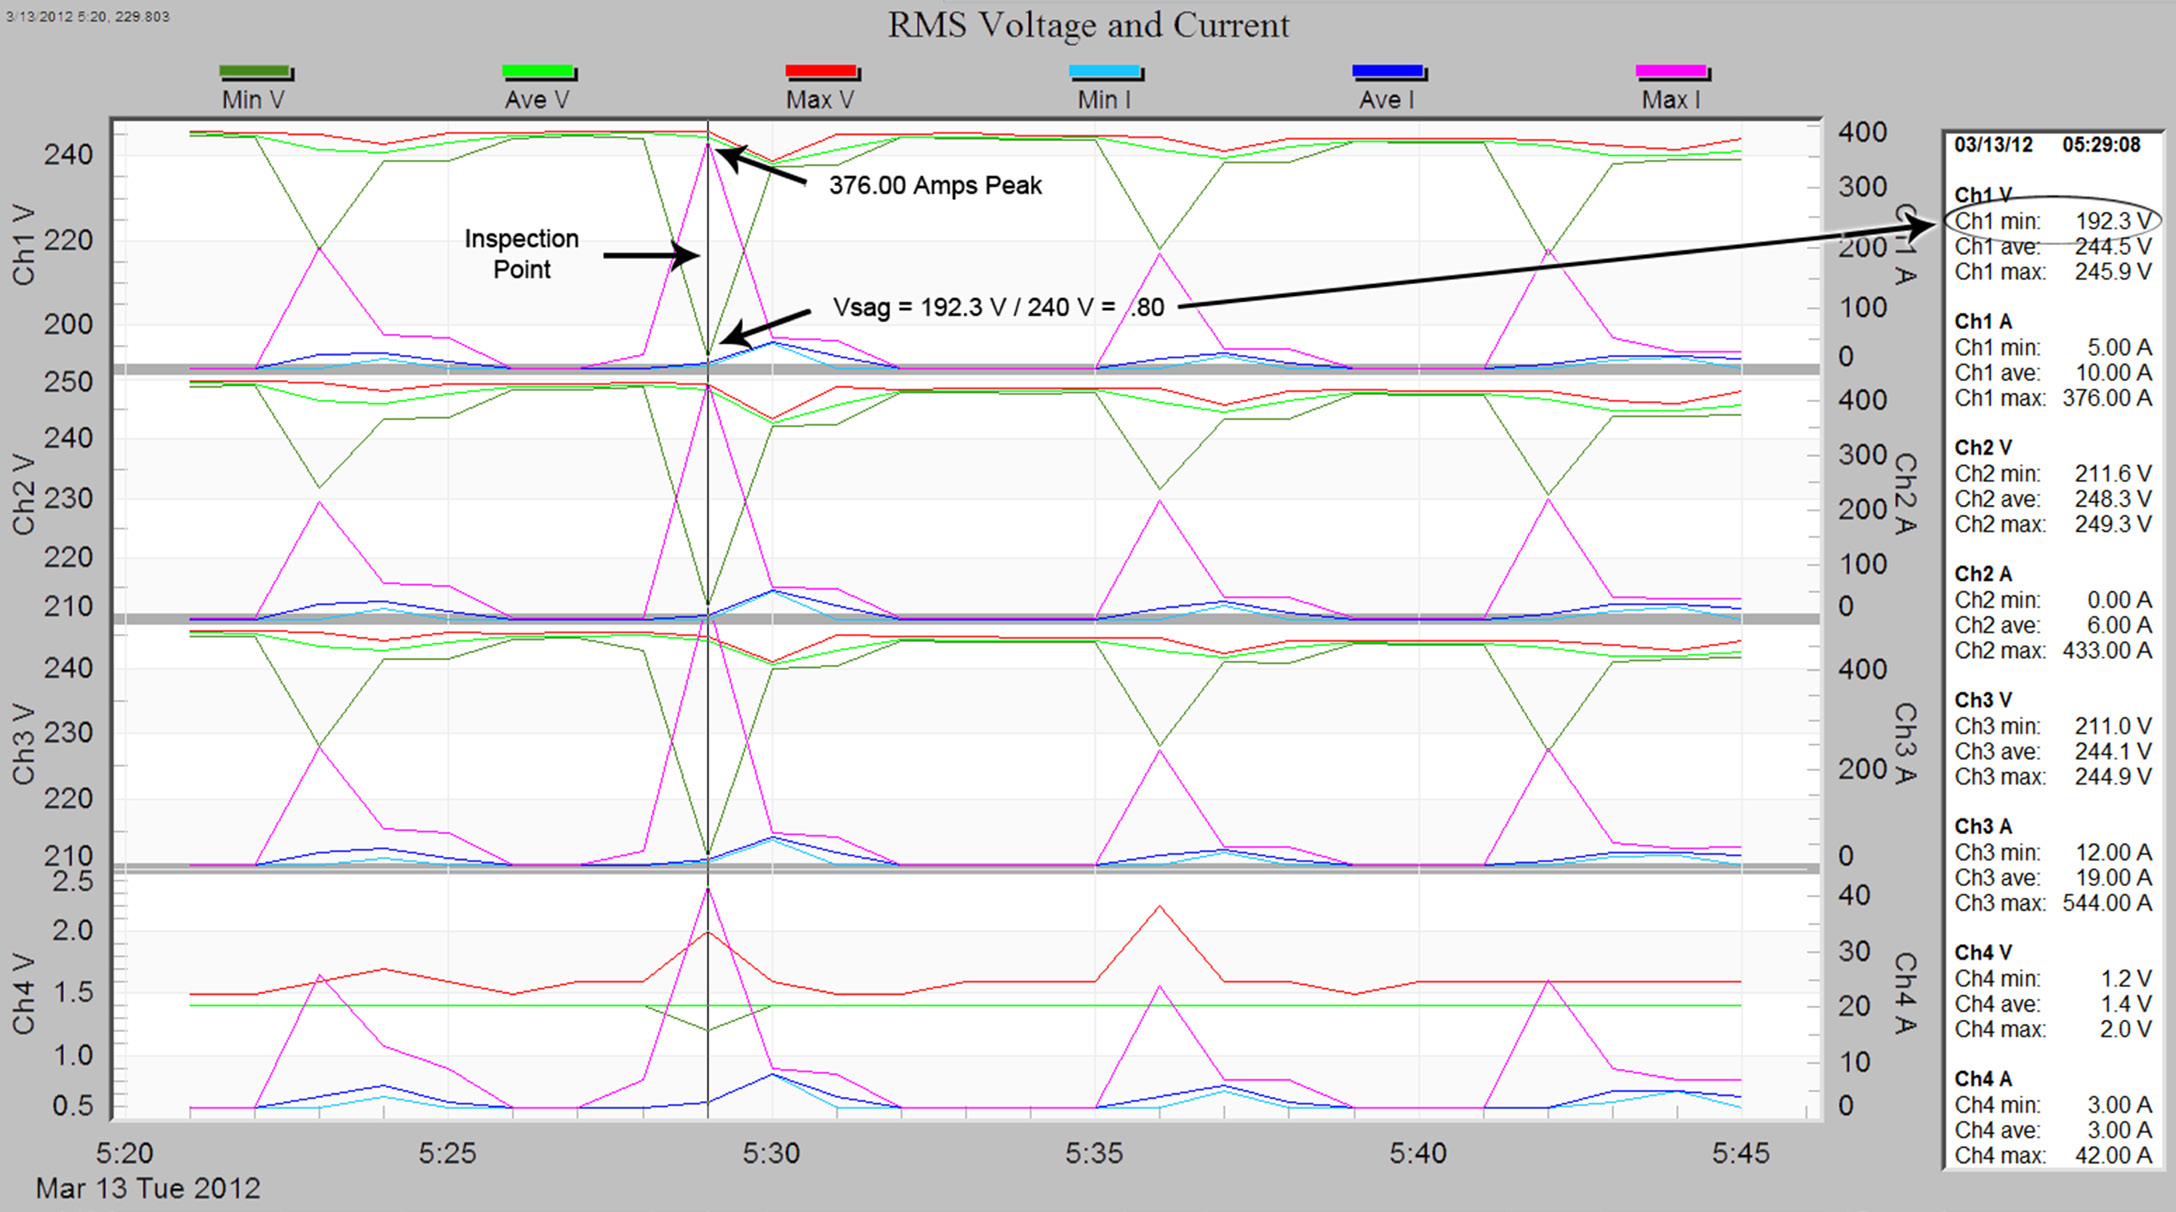
Voltage sag is stated as a percent of the nominal value we can calculate sag by using the equation (observed voltage / nominal voltage) = Vsag. In our case we would use (192.3 / 240) = 0.80 of the nominal value.
The out of limits report can also be used to determine the depth of the sag without the need for viewing the stripchart. The “min” value displayed for a given interval (Figure 1) should be used as the observed voltage in the above equation.
Determining the Source of a Sag
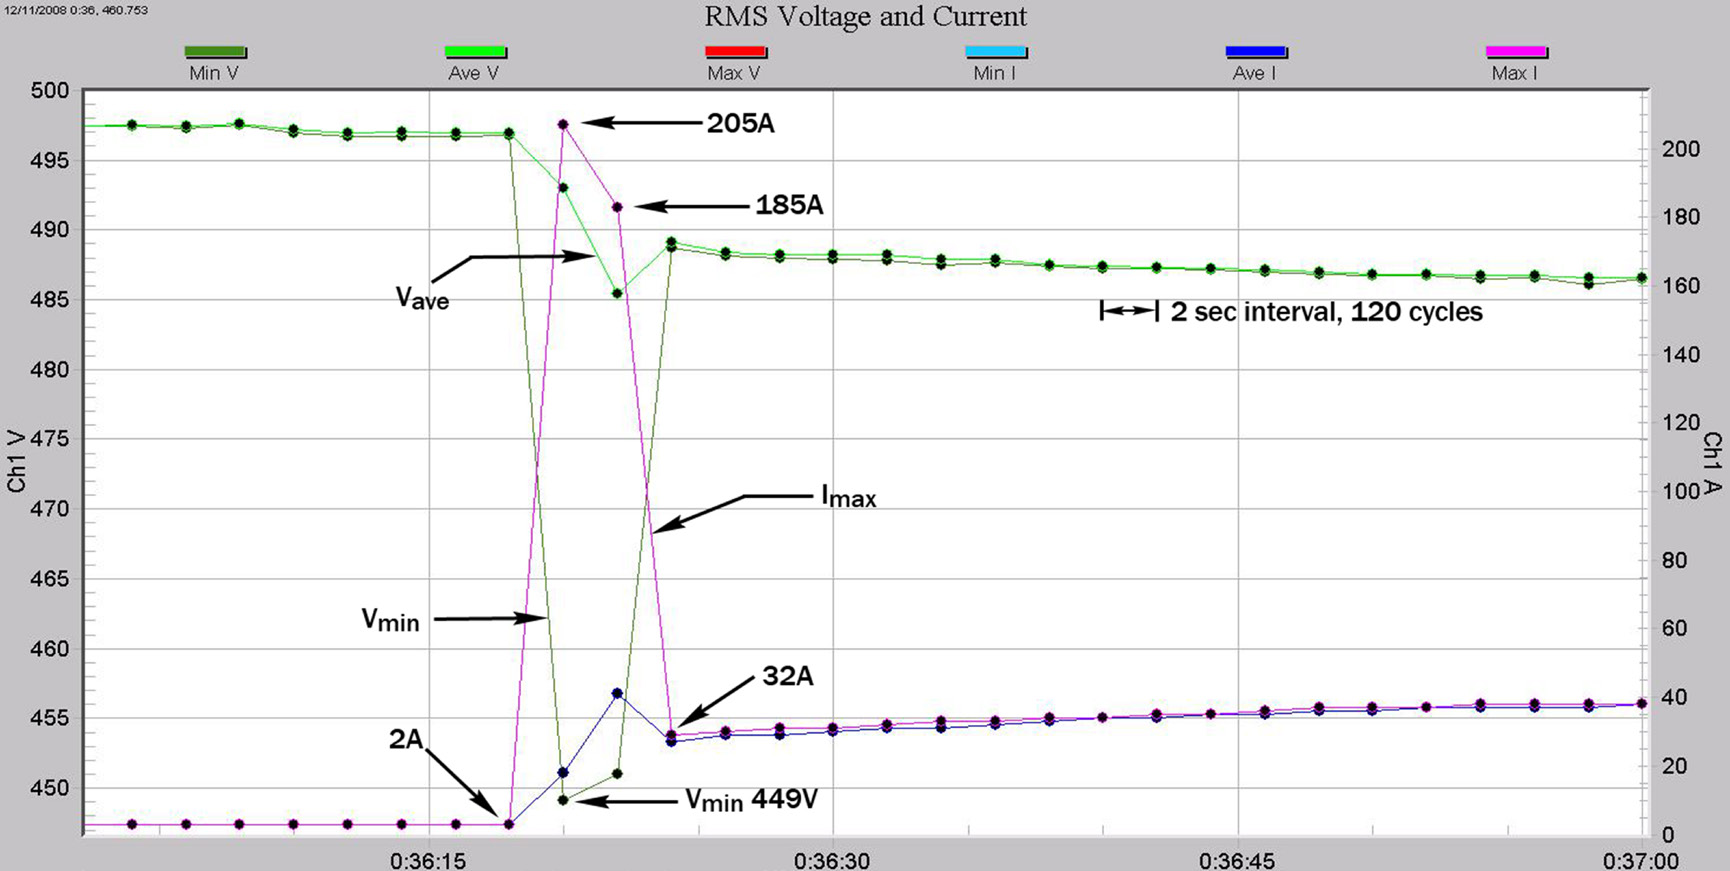
Sags can sometimes be attributed to upstream or downstream sources by comparing the voltage and current over the duration of a sag. If current increases (spikes) are coincident to the voltage sag, then it is likely that a downstream device is the cause – the current spike caused extra voltage drop in the system, resulting in a voltage sag at the monitoring point. If the current is unchanged during the sag, or drops slightly, the monitored load is probably not the source of the voltage sag. In reviewing the RMS Voltage and Current from a 480 Volt 3 Phase motor start, we can see that the voltage drop begins at the same time as the inrush current for the motor. (Figure 5.) Two-second intervals were used to provide an adequate level of detail allowing us to see this relationship without needing to use full waveform capture.
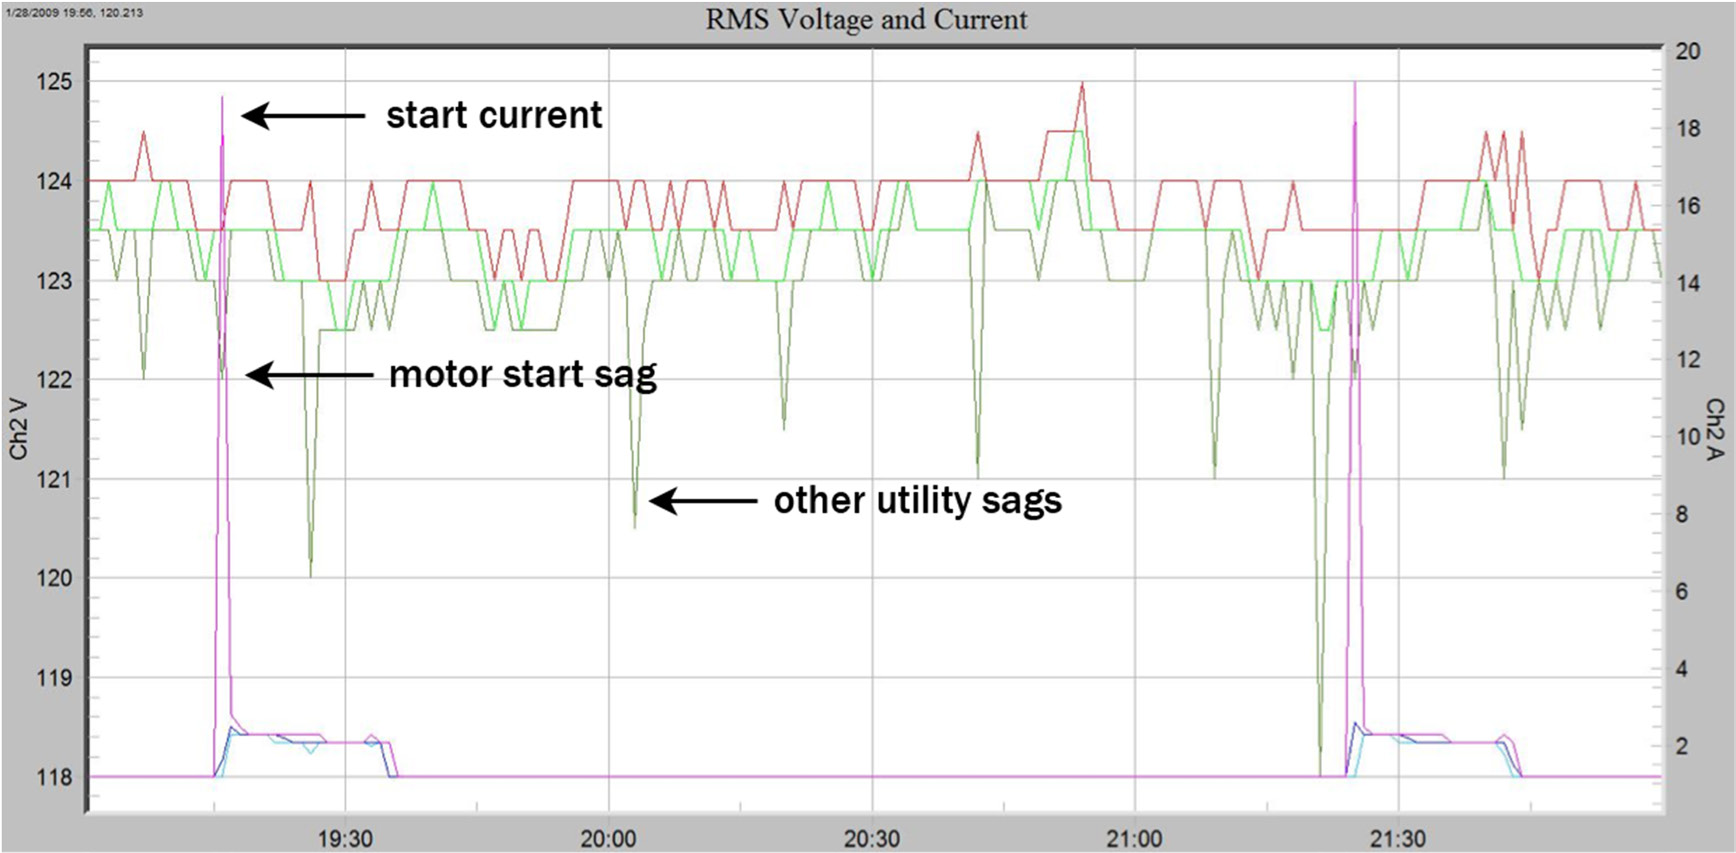
In the next example a 120V single phase Motor start has been captured and displayed over a 3-minute interval. (Figure 6) The large starting current of the motor once again coincides with the voltage sag indicating it is probably the source of the sag. Other sags can be seen without a measured change in the current indicating these must be from an upstream source.
Determining Sag Duration
Sags can be analyzed by using stripcharts or waveform captures for an event in question. To estimate sag duration using a stripchart you must know the recording interval (in this case 2 seconds). Figure 5 (above) is a stripchart that is averaged to 2-second intervals. Starting at 0:36:20 the inrush current induces a voltage sag that has a Vmin of 449 Volts and lasts for two intervals. To approximate a maximum sag duration we calculate: 2 intervals * 2 seconds/interval * 60 cycles/second = 240 cycles. Since Vmin is a measure of the lowest reading during an interval, a minimum sag duration for this example can be as small as 1 cycle!
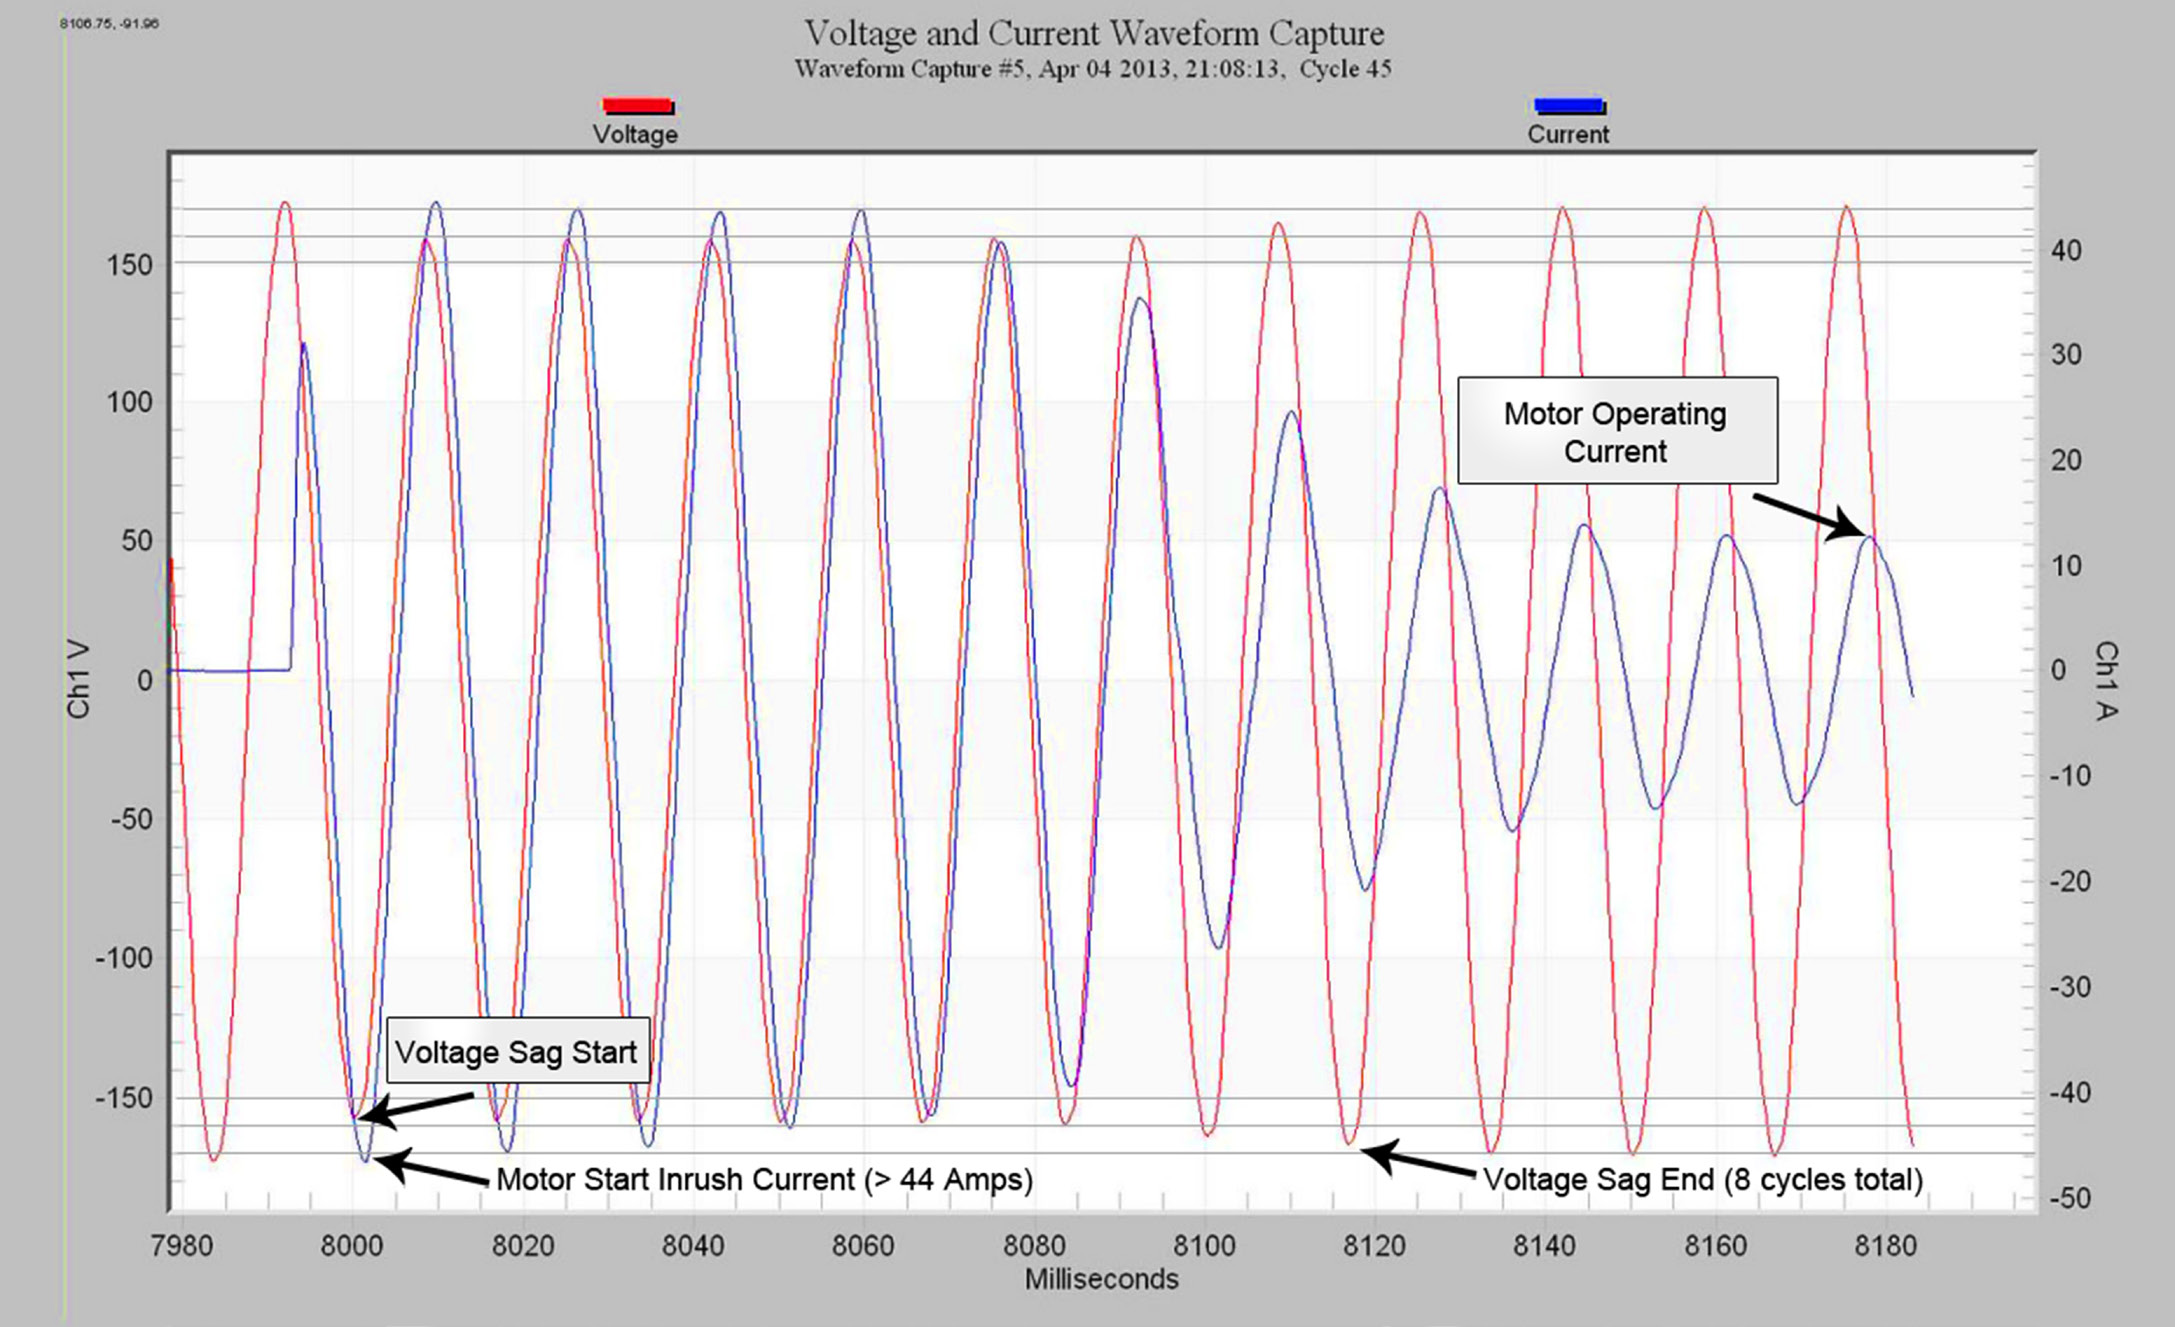
To get an accurate picture of the sag’s the Vavg must be factored in. Please see whitepaper 145 Computing Event Duration with Interval Data for an in-depth discussion. This method is useful if the sag is a significant fraction to the steady-state voltage. A more accurate way of determining the duration of a sag can be obtained from a waveform capture of the sag event. In Figure 7 a 120 Volt motor is energized producing an inrush current of 45 Amps. The voltage drop is visible starting at cycle #2 and continues for 8 cycles.
Conclusion
Analyzing voltage sags using ProVision is straightforward once you know what tools to use to get the job done. Using voltage out of bounds reports to find voltage sags is a quick and accurate way to scan recordings that may contain hours or days of information. If further analysis of sag events is necessary RMS Voltage and Current stripcharts provide time averaged values allowing an overview of the sag event. For more detailed analysis of sags a waveform capture shows the full detail for the events in question.
