Abstract
Identifying the sources for voltage sags can be a somewhat complicated task. Graphs such as waveform capture can obscure the essentials with an RMS-based voltage sag. PMI provides a triggered record type created specifically for capturing voltage events, and specifically to determine if the load being monitored is the cause of the event. This whitepaper will hone in on this specific triggered record type – Event Change – and how to use it to identify voltage sags and determine if the monitored load is the cause of the sag, or merely responding to it.
Voltage Sag Causes and Definition
Briefly, a voltage sag is defined by the IEEE as a reduction in RMS voltage by 10 to 90 percent of nominal voltage for a duration of one half of a cycle to a full minute. Anything less than 1/2 cycle is too short to appreciably reduce the RMS voltage enough to cause problems for most equipment. Low voltage for longer than 1 minute is considered a steady-state voltage regulation problem, not a sag. Voltage sags can be caused by a range of events, chief among them: short circuit, overload or a current spike resulting from an electric motor startup.
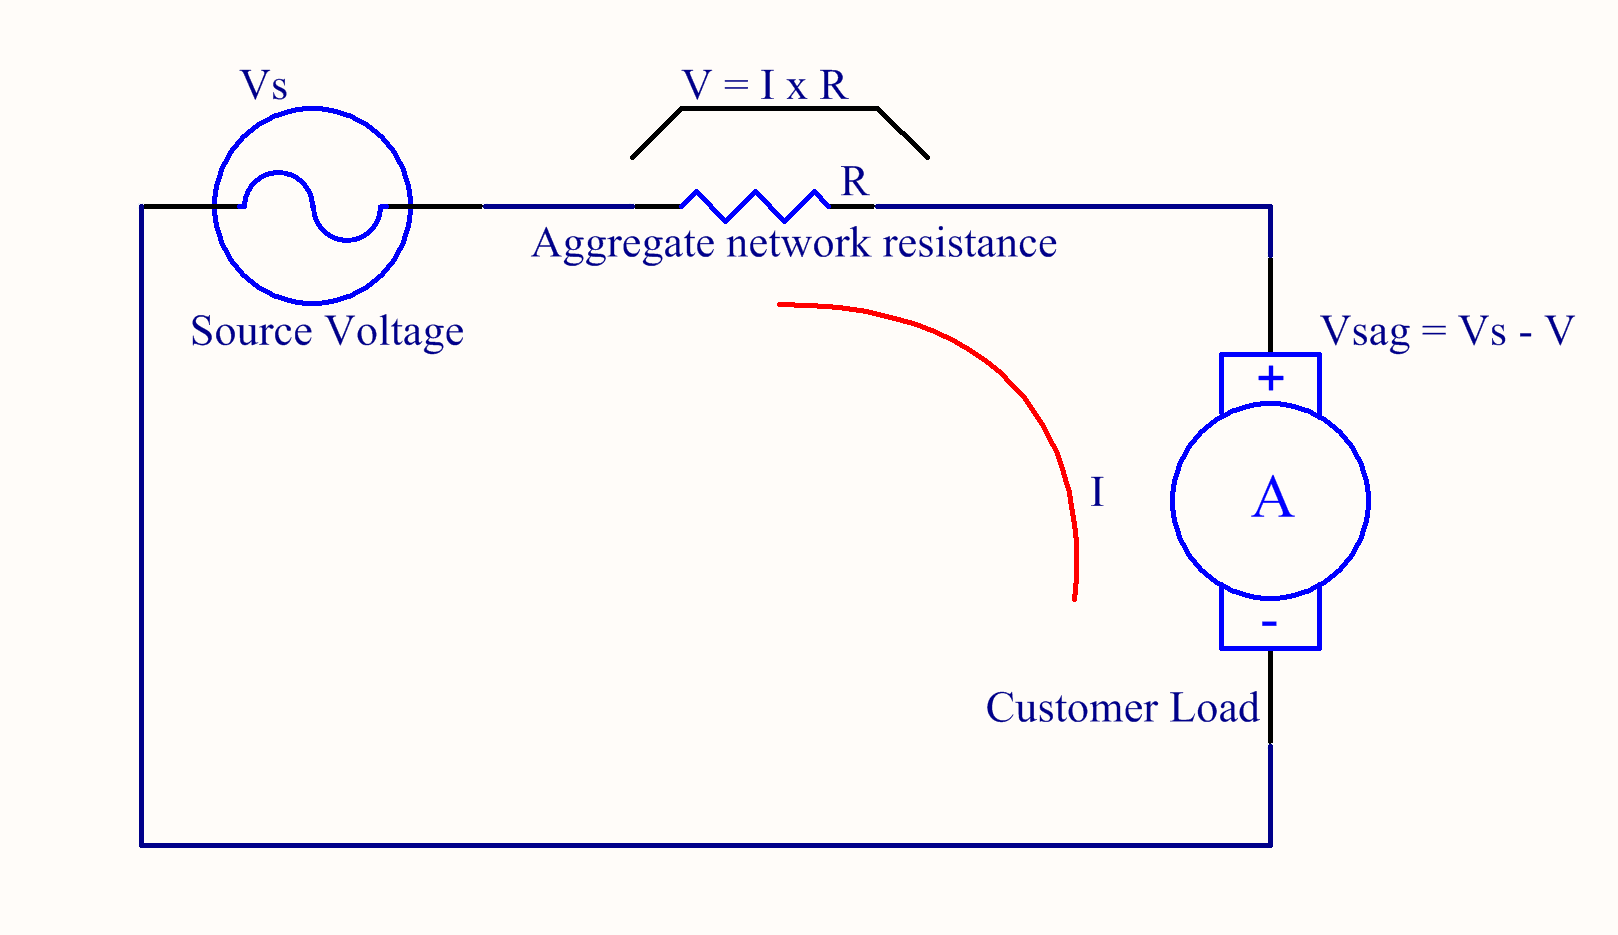
Customer-caused voltage sags are typically the result of voltage drop across conductors, transformers, and connections produced by excessive load current. The most common sag source is traditionally a simple motor, which draws a starting current up to 6 times the normal running current. During the motor start, which lasts from a few cycles to a few seconds, the load current is much higher than normal. This high current results in voltage drop through any series resistance due to Ohm’s law, as indicated in Figure 1. Other sag sources include tankless electric water heaters and other intermittent, high current loads such as welders.
Due to the potential brevity of these events, a triggered threshold is needed in order to be able to capture them. Conveniently, a triggered record type has been designed precisely to catch this type of power quality phenomena: the Event Change record. Event Change was created to capture the essential details of a voltage sag event, and provide details to help determine if the load being monitored is the cause of the sag.
Event Change
The Event Change record type is essentially a very lightweight form of waveform capture, but without the actual raw waveform points. Event Change is ideal in devices that do not have a large amount of storage space, or for situations with a great number of sags. Voltage sags are essentially RMS-level events, and a summary of the RMS measurements for the event is usually sufficient for an analysis. Instead of providing the entirety of the pre-, present and post- waveform cycle points of the capture, what the user is instead presented with is the pre-, present and post- waveform RMS values, along with the min and max values during the event.
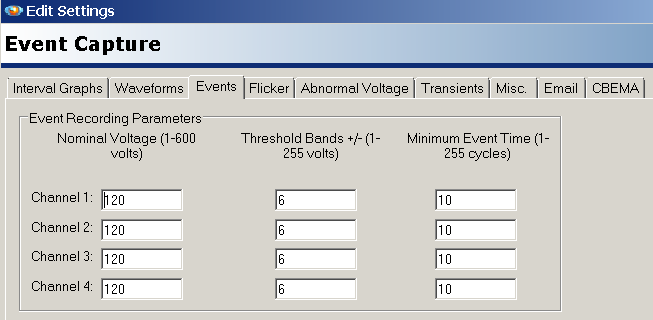
The triggering logic for event capture is relatively straightforward and involves three parameters: nominal voltage, threshold, and minimum event time. These settings are shown in Figure 2.
The nominal voltage used in event capture is a value specified by the user (it is not the automatically detected nominal voltage that is picked up by the device during the two minute countdown). This allows for non-standard or off-nominal voltage thresholds.
The threshold is a step voltage value to be used when determining the trigger points for event capture. The trip points are calculated using the step voltage down from the nominal voltage to zero and then up from the nominal voltage to the maximum recorder voltage. For example, a threshold of 4V at a 120V nominal would yield 120 +/- 4 = 116, 124; 120 +/- (4×2) = 112, 128; etc. If the RMS voltage crosses any threshold, an event is triggered (or ended, if it returns to the nominal window).
The final parameter, minimum event time, specifies how long to wait (in cycles) before demarcating the end of an event record. This parameter can prove useful to prevent longer-duration sag events from triggering multiple event capture records. (It is worth noting that this parameter only applies to unidirectional changes – e.g. if voltage is falling and continues to fall then the parameter will be observed, whereas if the voltage is falling and then rises (“switches direction”) the parameter will be ignored and a new record will be generated.
Finally, each event capture record contains both the minimum and maximum voltage and current during the event; the event duration (in cycles); pre- and post- event current (for all channels, not just the triggered channel); and the slope of the recorded event (rising or falling).
What to Look For
The key to identifying a voltage sag source is actually in taking note of the RMS current. If the user knows what the RMS current is supposed to be, then a comparison between the pre- and post- currents to the measured event current will enable the user to more easily identify a sag. (Remember, of course, that any rise in current will necessarily cause a fall in voltage as current is inversely proportional to voltage.)
Example
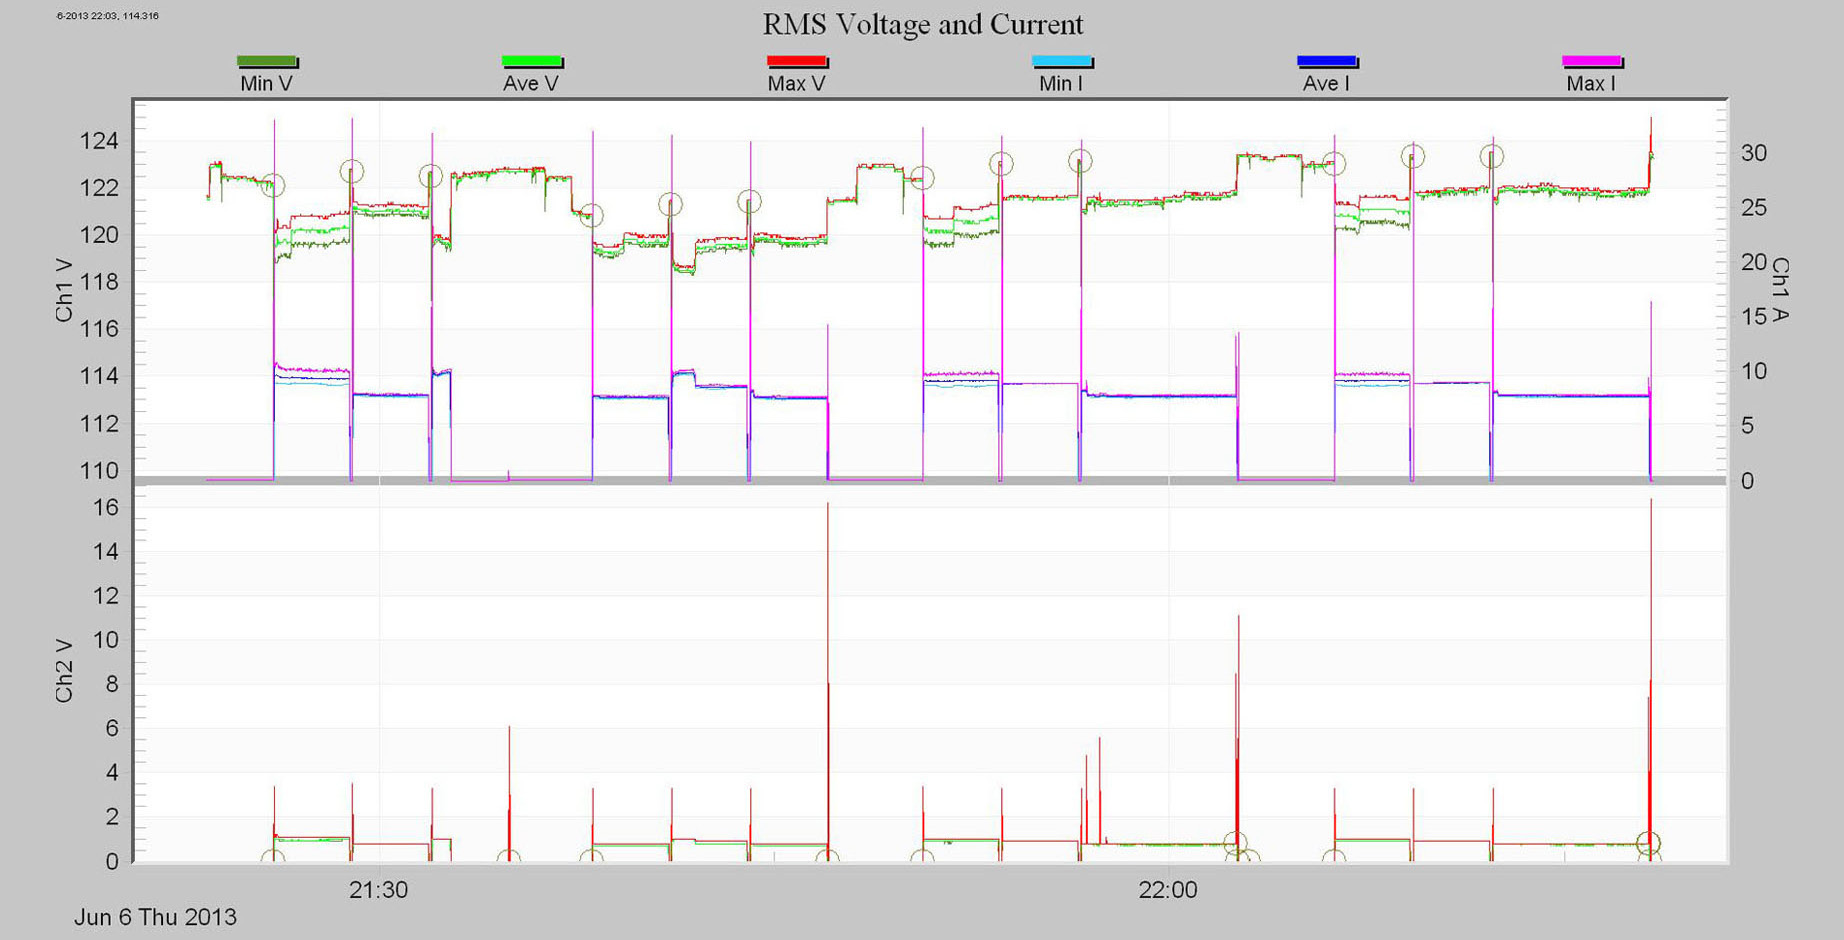
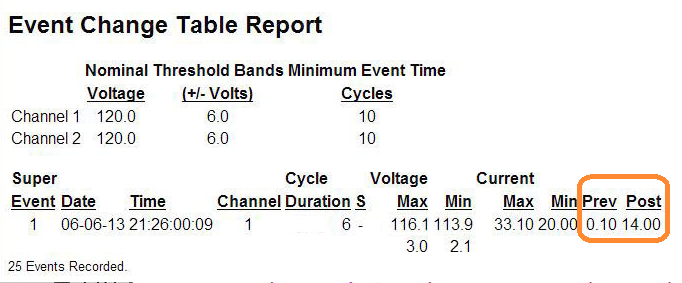
A typical motor start example is shown in Figure 3 in stripchart form. Here a simple motor start occurs periodically, with current spikes and voltage sags shown in the stripchart. The small circles on the graph are clickable annotations that mark Event Change records. Clicking one brings up the Event Change report for that capture, as shown in Figure 4. The RMS details are shown in the report. Here the voltage sagged down to a minimum of 113.9V on channel 1. The current during the event varied from 20A to 33.1A, over the 6 cycle duration. Most telling, the current one cycle before (“Prev”) and one cycle after (“Post”) the event is shown – 0.1A and 14A, respectively. This pattern is indicative that the load being monitored is the likely cause of the voltage sag.
A typical motor start involves a lower current before the motor is energized, a high starting or inrush current for a brief time (a few cycles up to seconds), and then stabilizing to a running current. The current after the event is the motor steady-state current plus an additional load that was also present before the motor start. This presents a pattern where the current before the event is the lowest, the current during the event is much higher, and the current after the event is in between these two levels (but usually much lower than the max). The values in Figure 4 meet this criteria, and is a strong indicator that the load being monitored caused the sag.
The RMS sag data may be used for CBEMA/ITIC purposes also. The minimum RMS voltage was 113.9V, and duration was 6 cycles, as per Figure 4. This is a 113.9/120 = 5.4% reduction, or sag to 94.6% of nominal, well within the 80% ITIC limit.
Other types of loads may respond to a voltage sag with an increase in current. A constant-power load such as an electronic power supply or Variable Frequency Drive (VFD) will compensate for lower voltage by increasing instantaneous current. This increase in current may seem suspicious, in that it could be the cause of the sag. However, the current before and after the sag will normally be much closer, since no new load was actually energized. This does not fit the pattern mentioned above.
Conclusion
Voltage sags can be a nuisance to customers and, in extreme cases, can cause physical damage to machinery, appliances, and other items. The ability to quickly and efficiently track down the sources of voltage sags can prove to be a very effective cost-saving endeavor – both by preventing damage and limiting the amount of time chasing down the cause(s). The triggered event capture record type is ideal for this role.
