Introduction
An engineer at PMI purchased a portable power station and wanted to verify the quality of the inverter before attaching sensitive electronics. The steps used to quantify the output quality of this power station using a portable 120V receptacle PQ analyzer are described. The PQ data is streamed to the cloud and analyzed using PMI’s PQ Canvass system.
Vendor Claims
The portable power station vendor claims to provide 500W Rated Power and 1000W Surge Power from the pure-sine wave AC port and provides stable power to mainstream electronics and small appliances. The inverter will shut off automatically if the load exceeds 500W. They claim 110V nominal at 60Hz. No further specifications are given on waveform distortion or other power quality metrics. The expectation is that a “pure sine” inverter should have a reasonable smooth sinusoidal voltage waveform. Lower cost inverters may use a stepped waveform approximation, or even a square wave.
Testing Setup
Testing was done with the Tensor plugged into the power station and two differently sized heaters plugged individually into the Tensor to provide the resistive loads. The Tensor was configured to capture one second average Voltage, Current, Real Power, and Voltage THD with one minute periodic waveform capture set. Triggered Waveform Captures were initialized to have 50 pre and 50 post-cycles. The stripchart and captured waveforms were analyzed using PQ Canvass.
Analyze Inverter Without a Load
The power station claims 110V nominal. Figure 1 shows the one second average RMS Voltage interval graph. This graph shows a consistent 109.9-110V average without load, and Figure 2 shows a frequency of 60.56 Hz.
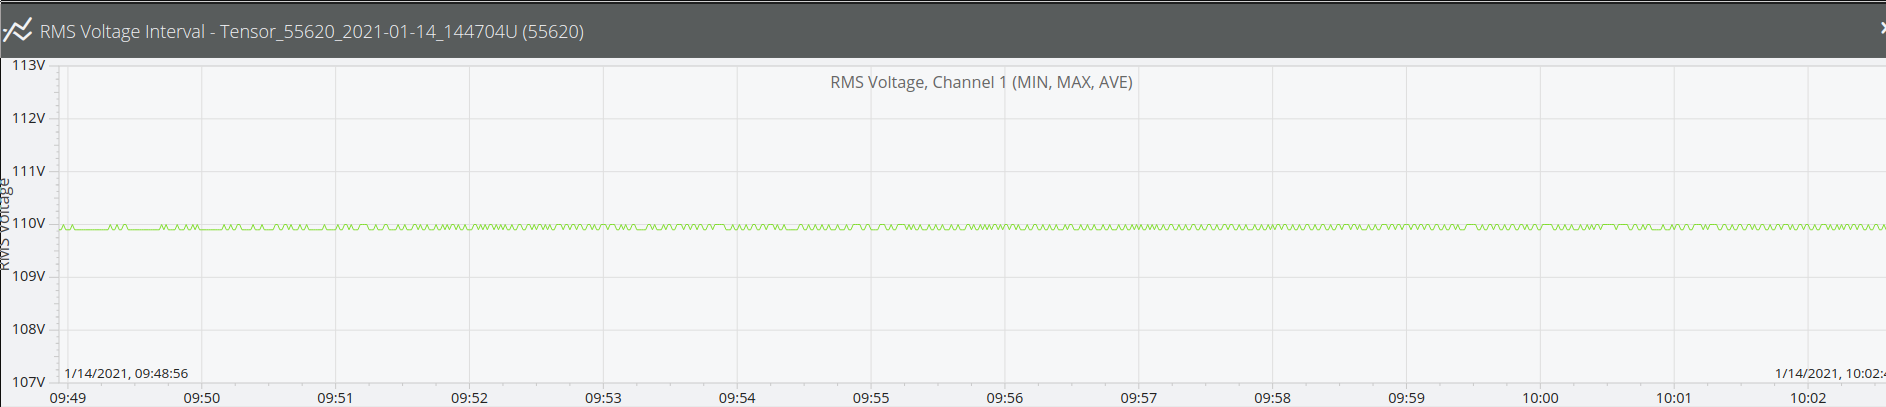
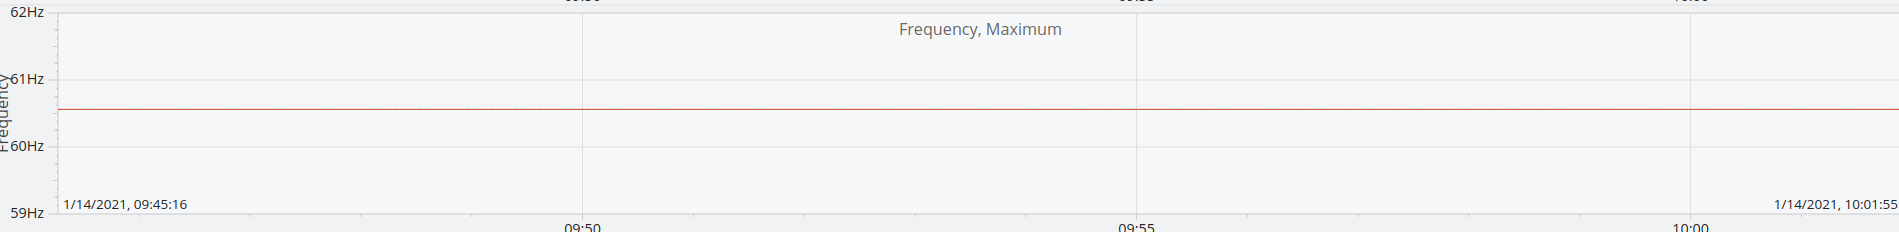
Figure 3 shows the live voltage sine-wave. Figure 4 shows the meter values calculated from this sine wave. There are several values that are important for connecting electronics and they will be explained in further detail. Here, we will focus on the voltage readings, as that is what is produced by the power station while the current readings are driven by the load.
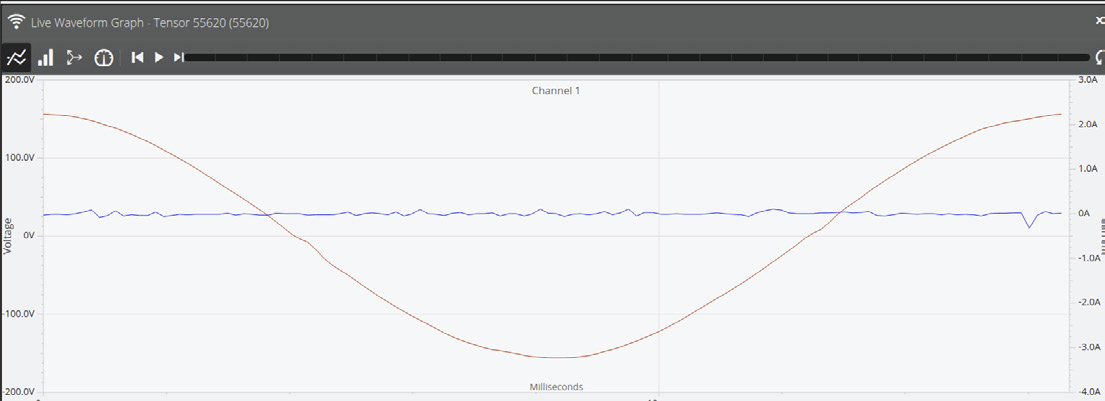
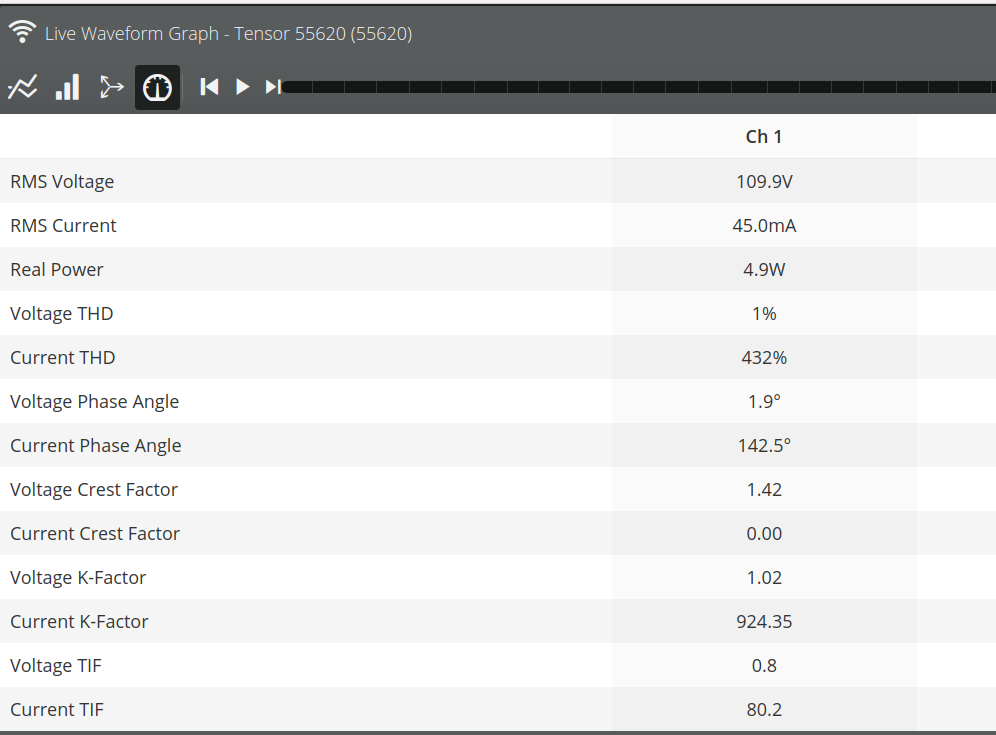
The RMS Voltage for this unloaded waveform is 109.9V, very close to the stated spec.
THD is a way of quantifying the amount of harmonic content in a voltage or current waveform. Expressed as a percent, the THD is a comparison of the 60Hz fundamental magnitude to the total of all harmonics. A value of 0% indicates a pure 60Hz sine-wave with no distortion. Typical utility distribution voltage THD levels are 0.5% to 5%. The 1% voltage THD shows a reasonably clean sine-wave, well under the IEEE 519 limit of 8% on circuits below 1 kV.
Crest Factor is an important measure for sensitive electronics loads. Crest Factor is another distortion metric, one that emphasizes a specific time-domain deviation from the ideal sine wave compared to THD, which is focused on harmonic distortion. The value is defined as the ratio between the peak voltage and the RMS voltage. Crest Factor is, therefore, calculated by taking the peak of the instantaneous voltage in a cycle and dividing it by the RMS voltage for that cycle. Note that the peak could occur in a positive or negative half cycle. A clean 60 Hz sine-wave should have a ratio that will equal to the square root of 2. A square wave will have a crest factor of 1.00. The 1.42 value produced by the power station also indicates a good clean sine-wave.
Without load, the power station does produce a pure sine-wave with a 110V nominal at 60Hz as claimed by the vendor.
Analyze Inverter with a “Too Large” Load
A 570W load from a heater was added which exceeded the 500 running Watt rating, but remained below the 1000 W surge limit, to verify the automatic inverter shutdown.
Figure 5 shows the one-second average voltage and current interval graph. We can see from this graph that as the current rose the voltage sagged. In a few seconds, the inverter automatically turned off, dropping the voltage. With no voltage output, the current also went to zero.
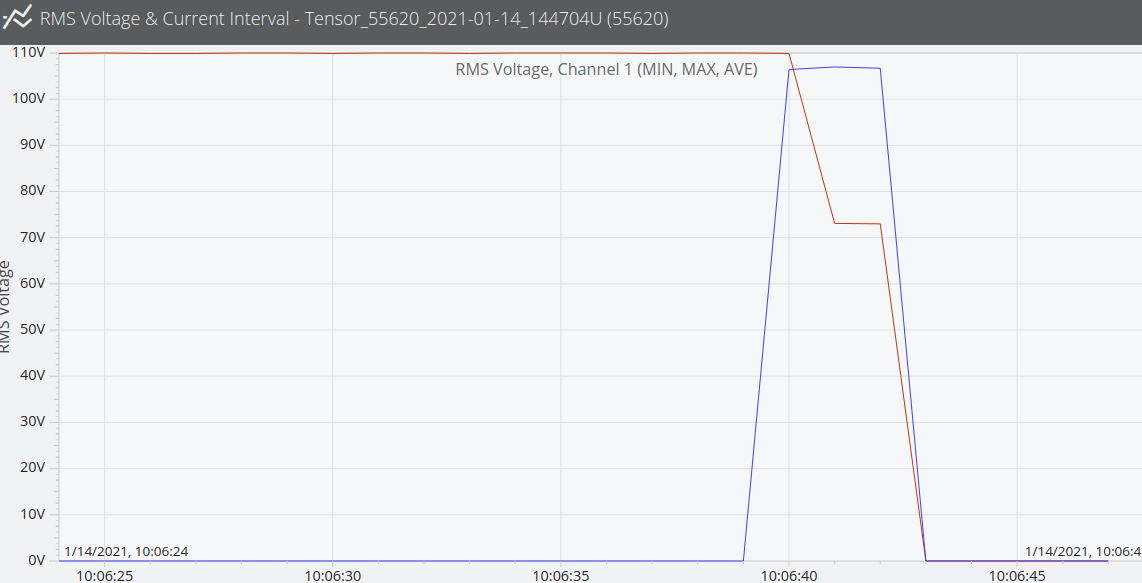
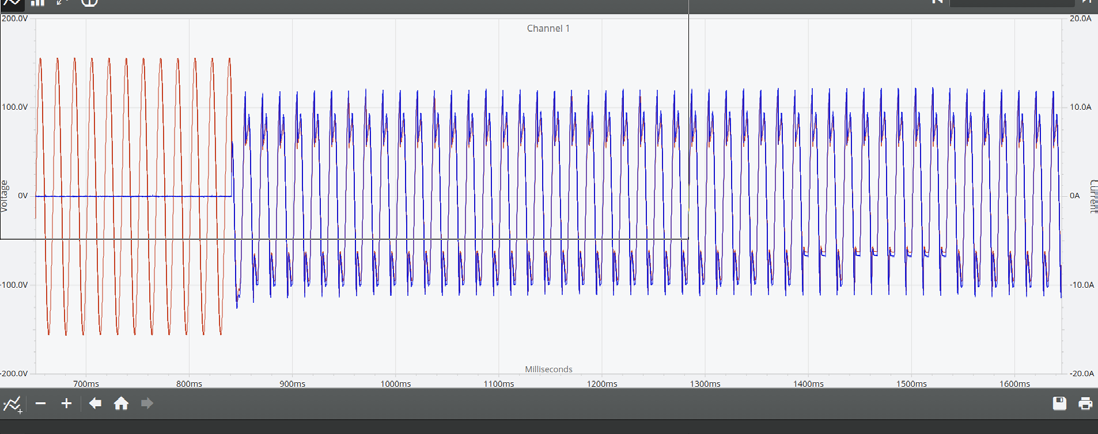
The triggered waveform capture in Figure 6 shows the waveform at the moment the heater is turned on.
Analyze Inverter with a Load
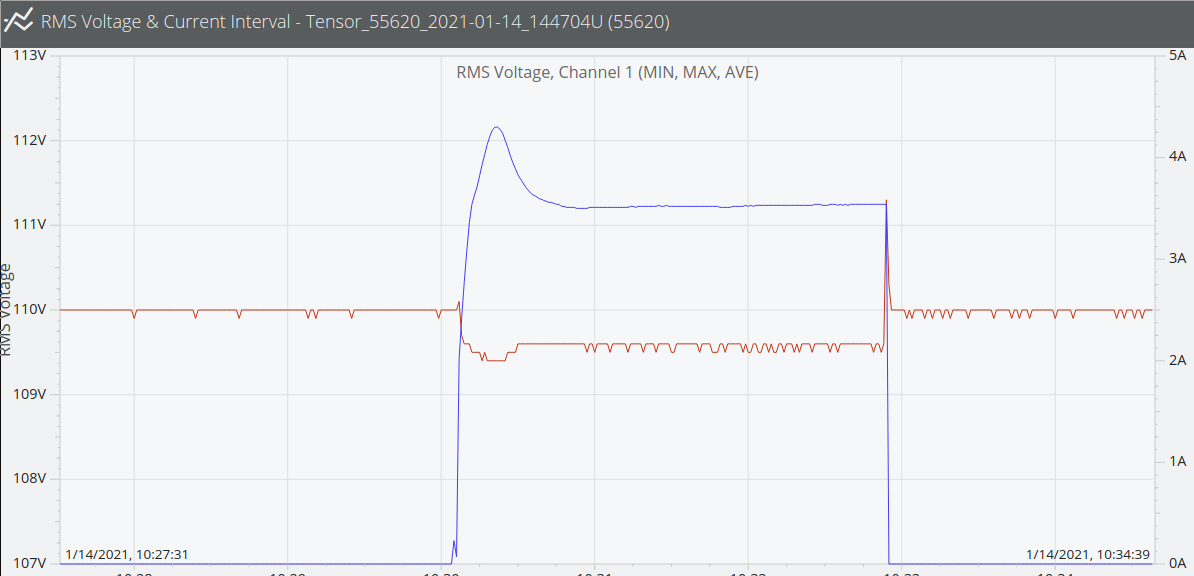
A smaller heater was used to provide a load of 350W. Figure 7 shows the one second average voltage and current interval graph. We can see from this graph that the current pulled down the voltage about a half volt while the heater was on. When the load was removed the voltage overshot a couple of volts and was soon regulated back to the 110V nominal. This overshoot phenomenon may be why the nominal is set to 110V rather than 120V.
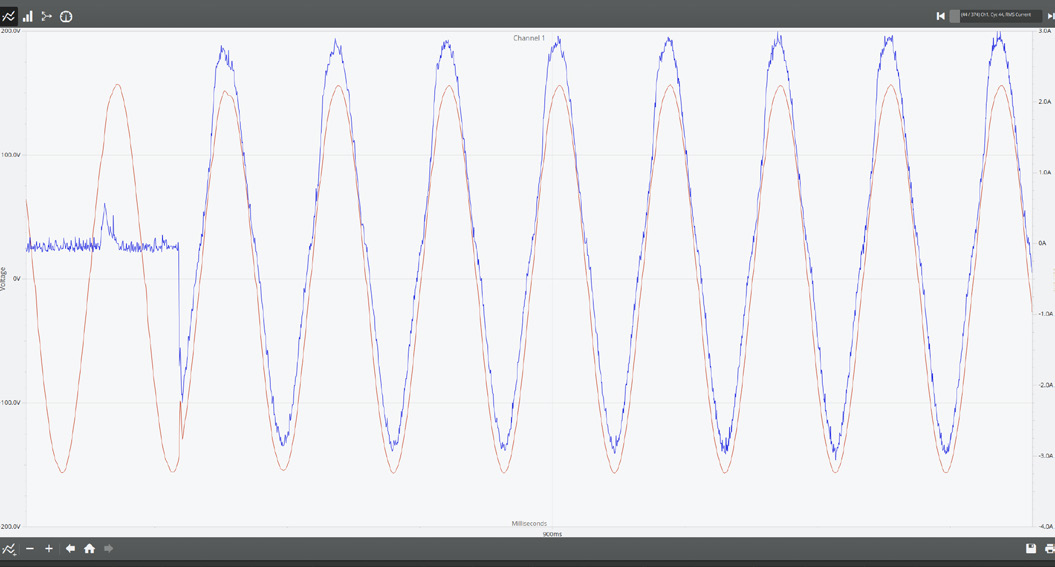
When the heater was turned on, the triggered waveform (Figure 8) shows the noise on the switch and then the current in-rush. Figure 9 shows the capture zoomed in at the startup of the heater.

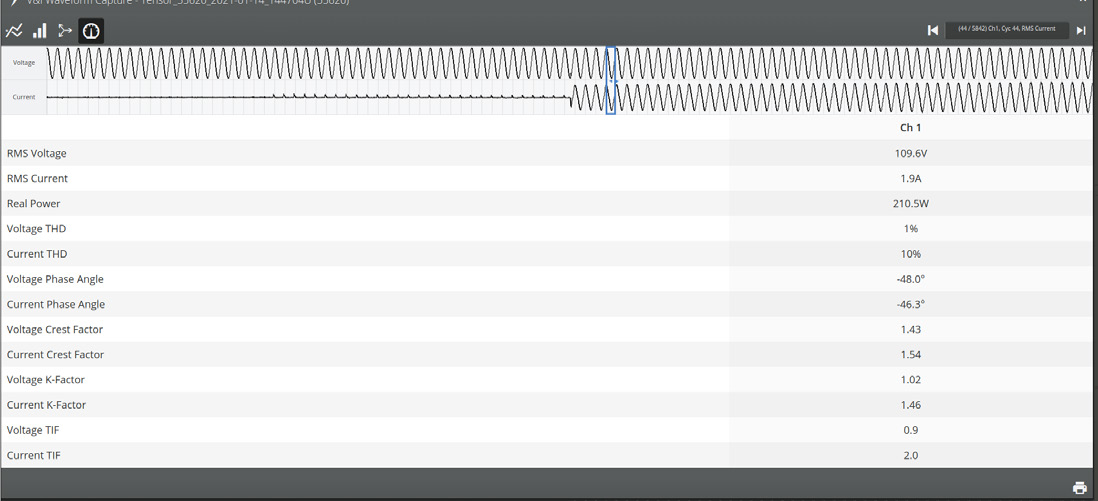
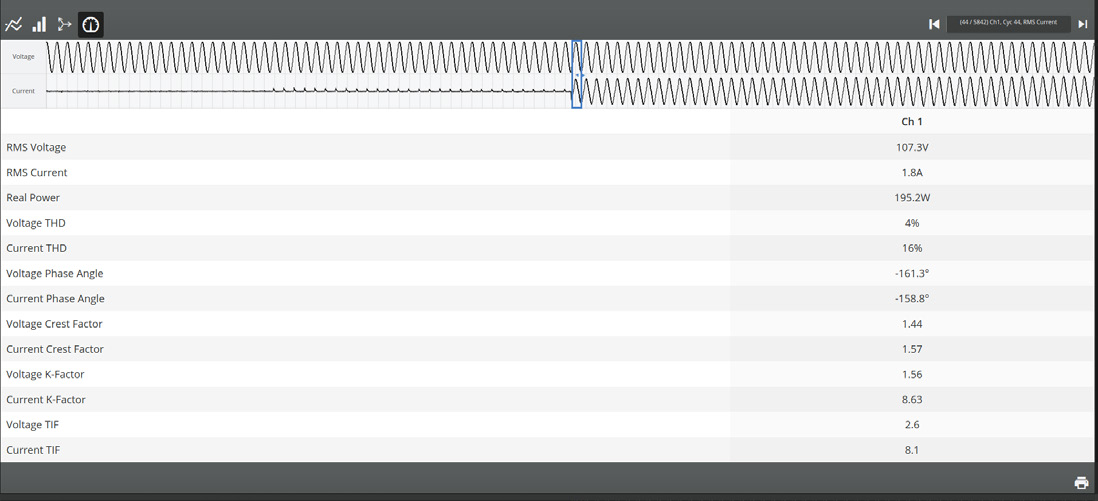
Next, we go to the calculated waveform values of the first cycle with the heater current as shown in Figure 10. As the current is applied, the voltage lowers to 107.3V, the THD is 4%, and the Voltage Crest Factor is 1.44. These values are in the good range. Figure 11 shows the same values for a waveform several cycles later, after values have time to settle. THD is good at 1%.
Conclusion
The portable power station’s inverter produces a pure sine-wave that is suitable for sensitive electronics. PMI’s Tensor Power Quality Recorder and PQ Canvass software provides the tools needed to analyze the inverter power quality, or for any 120V receptacle PQ investigation.
