Abstract
Canvass, PMI’s cloud-based data analysis portal, has recently been upgraded to provide the facilities for apparent and reactive power analysis for plug-in and meter-socket form 2S Boomerangs. This white paper will briefly describe what each of these measurements are, how they are calculated and how to analyze them within the Canvass system.
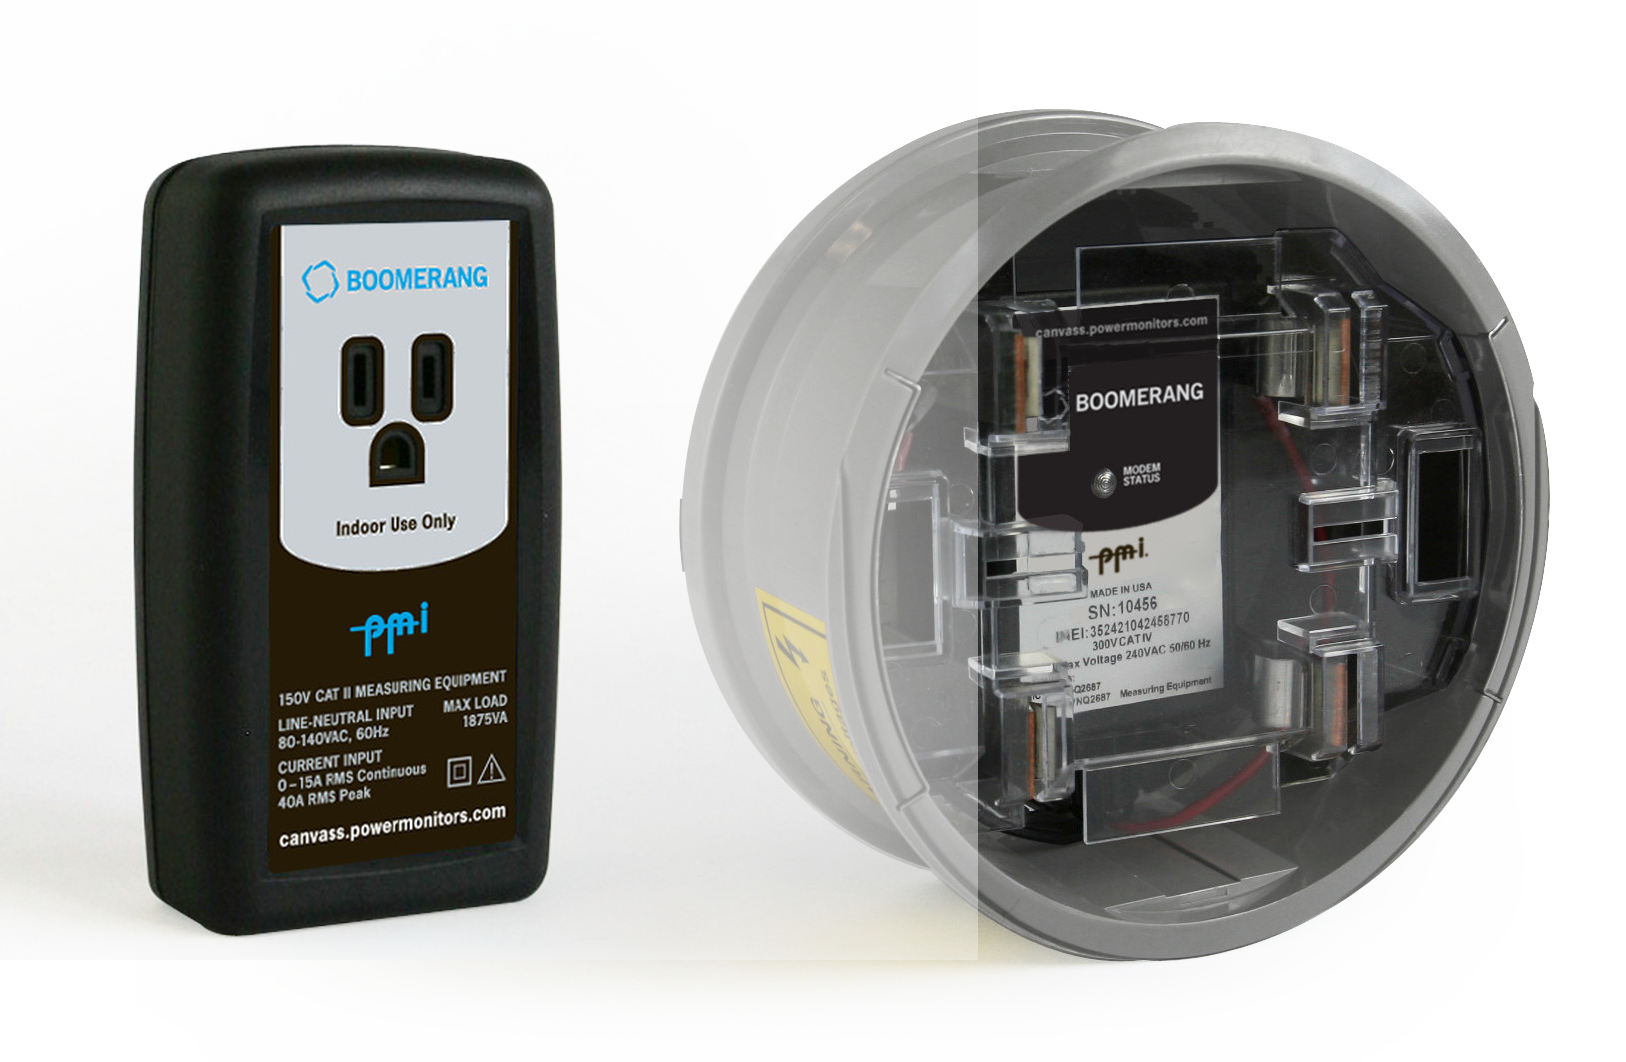
The single phase Form 2S and 120V plug-in Boomerang can measure RMS voltage, and with the current option, RMS current and real power. These values are measured as 1 second averages, and every few minutes a compressed block of 1 second readings are sent from the Boomerang to Canvass. The result is that Canvass has complete second-by-second trend data for RMS voltage, current, and real power.
Canvass has been upgraded to compute reactive power (VARs) and apparent power (VA) from the raw incoming data, and provide that as stripcharts just like the original data (Figure 1). These stripcharts are equivalent to the Boomerang sending data, but without incurring the extra cell usage costs to send redundant information. In addition, reactive and apparent power are available for any historical data where RMS voltage, current, and real power have already been logged in Canvass.
Reactive Power (Volt-Ampere Reactive / VAR)
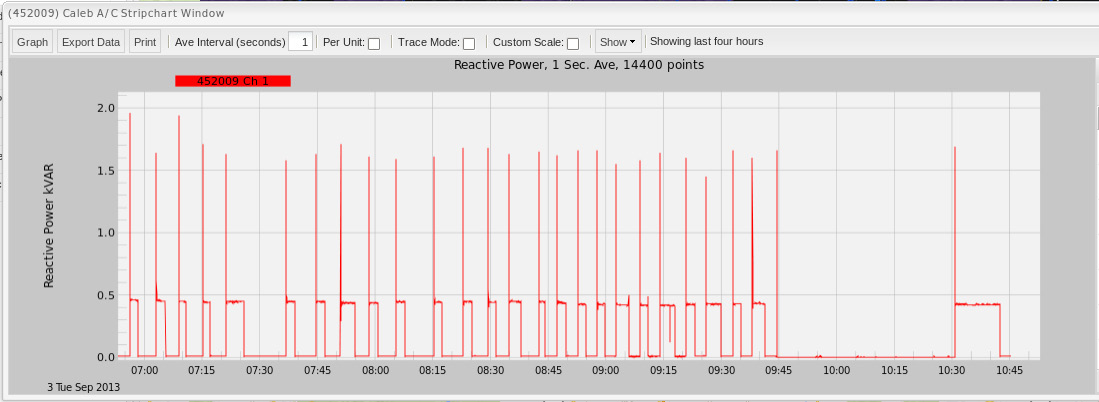
In simple terms, reactive power in an alternating current (AC) system can be defined as a concept used to describe the background movement of energy. Devices storing the energy resulting from the generation of a magnetic field “absorb” reactive power (inductive loads such as motors and transformers); those devices that store energy as a result of a generated electric field are said to “generate” reactive power (capacitive loads such as power factor correction caps). Reactive power represents current flow in an AC system that isn’t used to supply net real power. Reactive power can be thought as power that flows in one direction during one 60Hz half-cycle, then flows back in the other half cycle, resulting in no net power transfer anywhere. Unfortunately moving this reactive power back and forth through the distribution system incurs real losses due to copper wire resistance, transformer inefficiencies, etc. A graph of reactive power is shown in Figure 2.
Apparent Power (Volt-Ampere / VA)
Apparent Power is simply the product of RMS voltage and RMS current in an AC system. It’s the power that “apparently” is being transferred given the voltage and current readings (but may not be actually transferred), and includes the effects of reactive and real power. Most distribution equipment is rated by apparent power rather than real power (e.g. distribution transformers), since losses (and heating) are usually proportional to the current or total apparent power, not just real power.
How VA and VAR Are Computed in Canvass
At present, only single-phase socket and plugin Boomerangs support the calculated Apparent and Reactive Power stripchart graphs in Canvass. Revolutions measure Reactive and Apparent power directly and report them to Canvass as well – these values are not calculated in Canvass, due complexities with 3-phase calculations.
As mentioned above, Apparent Power (VA) is calculated by Canvass as: VA = VRMS x IRMS (the product of RMS voltage and RMS current). This is done for each 1 second voltage and current reading, and results in a 1 second VA stripchart trace, with the same time resolution as the others. A graph of Apparent Power is shown in Figure 3.
Reactive Power (VAR) is calculated as: the square root of Apparent Power squared minus Power squared. This is the formal definition of reactive power for a non-harmonic 60Hz system. With the presence of harmonics, the VA and Watt readings will include harmonics, and thus so will the VAR value from the formula.
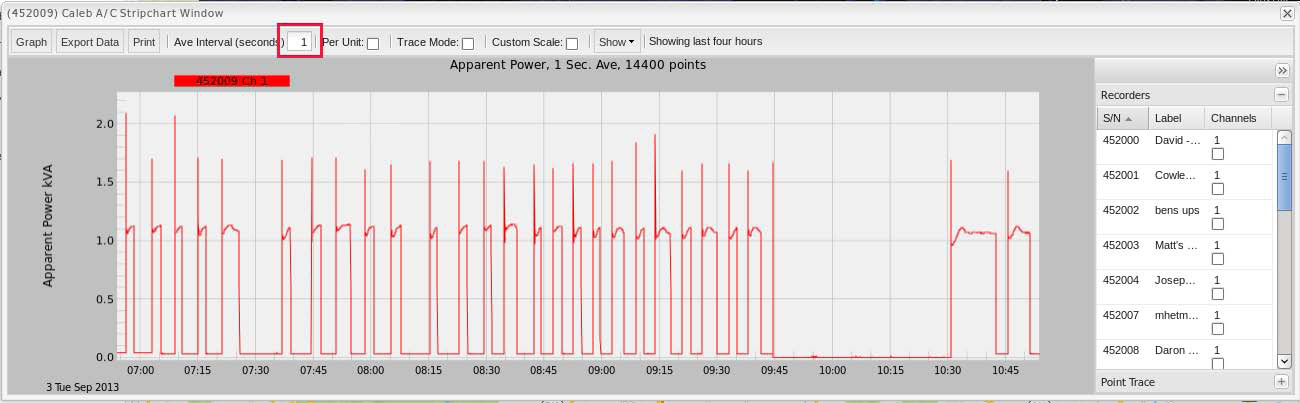
All Boomerang voltage and current readings are reported to Canvass using one second intervals. Consequently, one second is the smallest interval that can be selected for Boomerangs in Canvass. Values greater than one second can be specified in the “Ave Interval” box at the top of the graph window. If a larger interval is selected, the VA and VAR values are computed with 1 second values, then averaged to form the larger interval values.
Graph Availability
Even though the Reactive and Apparent Power graphs are recent additions to the Canvass feature set, the timespan of available Reactive and Apparent Power graphs has been significantly expanded by using calculated values. This means that as long as a Boomerang has been reporting current, voltage, and power data to Canvass, Reactive and Apparent graphs are available.
Viewing a Reactive or Apparent Power Graph
To view an Apparent or Reactive Power graph, first select a Boomerang capable of recording current. (Again, the Revolution also is capable of graphing Reactive and Apparent Power, but because the Revolution measures these values directly (it is not calculated in Canvass), only these directly-measured readings that have been reported into Canvass can be viewed).
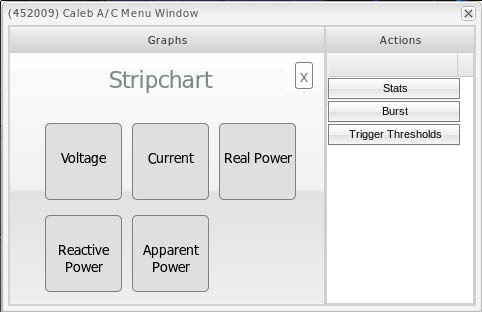
Selecting a Boomerang (or Revolution) will bring up the main graph window. From this window, select the Stripchart option. The stripchart menu is now available. If the user has selected a single-phase Boomerang that measures both RMS voltage and RMS current, then the Reactive Power and Apparent Power graph menu buttons will be available. Select either graph and the data will be computed and displayed.
The apparent and reactive power may also be exported as CSV data out of Canvass, just as with RMS voltage, current, and power.
Conclusion
The addition of Reactive and Apparent Power graphs to Canvass has significantly enhanced and augmented the application’s feature-set. By using calculated values for single-phase Boomerangs, the timespan of available Reactive and Apparent Power graphs have been extended far beyond the roll-out date of the new feature-set.
