Abstract
The purpose of this paper is to show just how easy it is to use the Vision® Recorder’s on-board user interface while providing some tips and tricks for quick and efficient navigation. The Vision® Power Quality Recorder is one of the most innovative products developed by Power Monitors, Inc. It has all of the capabilities of the Revolution power quality recorder, but with a twist; the Vision® comes with an integrated, full-color graphic display allowing the user to make spot-measurements or to view and analyze long-term recordings.
User Interface
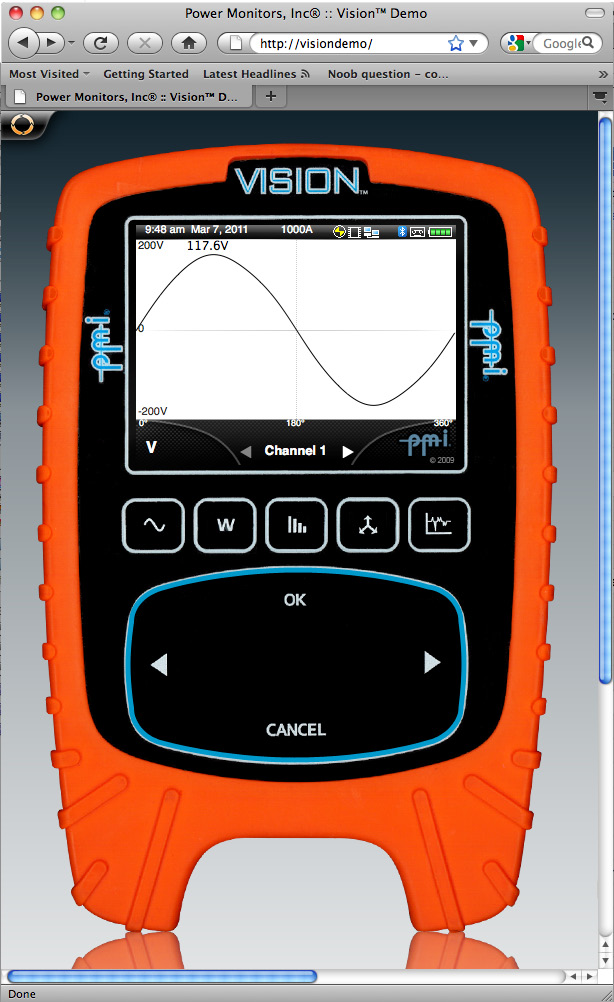
The Vision® user interface was designed with simplicity of navigation in mind. We wanted to eliminate the need for nested menus with soft keys and other confusing elements of embedded user interface design while still providing as much functionality and data to the user as possible. One of the ways we did this was by providing what we call a “perimeter menu.” Each screen on the vision is designed to provide relevant options such as a set of boxes around the perimeter of the screen in addition to providing a “preview” display in the center of your available menu options. Scrolling clockwise/counter-clockwise on the scroll-pad will select different menu items.
To demonstrate the ease with which the user can quickly navigate through recorded data on the Vision, we will take a brief look at a Histogram graph. To begin, we will select Histograms → RMS V → Graph Channel. The “Graph Channel” option displays the Histogram graph in “Channel” mode. Pressing the left and right arrows on the scroll-pad when in this mode displays the histograms for different channels from the recording as shown in Figure 1.
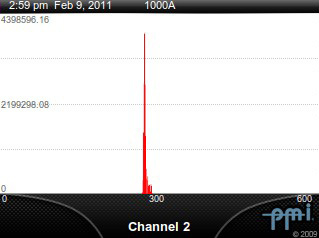
To take a look at the Real Power Histograms, navigate through the menu system again (OK/Up → Histograms → Real Power → Graph Channel) or just press the Down/Cancel button. This will toggle the screen from “Channel Mode” to “Measure Mode.” Measure mode allows the use of the left and right arrows on the scroll-pad to switch between different “measurements” (i.e. voltage, current, real power, reactive power, etc.) The present mode is always indicated on the bottom of the screen with a channel selection display, or a measure selection display, as shown in Figure 2.
The Histograms graphs are not the only places where using the Down/Cancel button can be used to toggle between modes. In Waveform analysis, for instance, pressing Down/Cancel will toggle between “Channel Mode” and “Waveform Selection Mode.” If your recording contains several waveform captures, toggling between “Waveform” and “Channel” modes can be a very convenient way to quickly look through dozens of captures on all enabled channels without having to navigate through the menu system again.
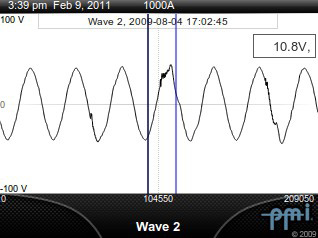
The Vision is capable of zooming in on graphed data as well. The default graph view is to show as much data to the user as possible (a general overview of the recording). Sometimes, however, it is necessary to get a more fine-grained and detailed look at the recorded data on the graph. This is where the Vision’s zooming feature comes in handy.
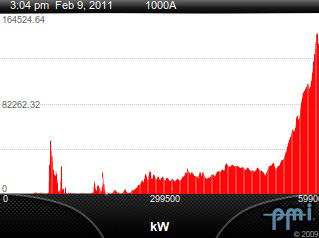
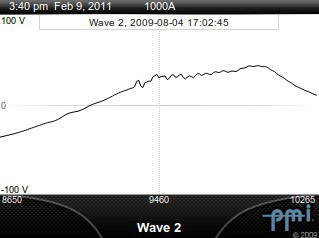
To zoom in on any recorded data graph simply start scrolling on the scroll-pad in a clockwise direction. This will put the device in “Trace Mode,” as shown in Figure 3. As you continue to scroll across the graph, the trace value box (on the right-hand side of the graph) will display the value at the cursor (trace bar). To zoom, move the cursor to the left-most edge of your desired zoom region. Once you have placed your cursor, press OK and the cursor will “lock” in place; a second cursor will show up just a few points to the right of the locked cursor. Move this second cursor to the end or the right-most side of your desired zoom region and press OK again. The graph will be redrawn and rescaled to show only the data between your two cursors as shown in Figure 4. You can repeat this process as many times as desired.
Note: Pressing the Down/Cancel while in zoom mode will undo your current zoom level and take you out of zoom mode. Therefore, you cannot switch between Waveform Selection Mode and Channel Mode while zoomed in.
As evidenced by the few examples above, the Vision user interface is a feature-rich, powerful yet simple user interface. The menu layouts and behaviors are consistent on each screen and the options are clear and descriptive. The data and functionality that you need are never more than a click and a scroll away.
In order to fully demonstrate the true functionality of this Vision® Recorder, the engineering team at Power Monitors, Inc. has developed an interactive online interface that allows a participant to directly experience the capabilities of this device. Call us anytime to schedule a one-on-one demonstration.