Abstract
The proliferation of cellular networks has allowed for quick access to information when it is needed. This quick access to information is available from all of PMI’s cell enabled products (Boomerang, Revolution, and Guardian) in the form of Email messages or SMS text alerts. The information, in this case, is based on user programmed alert levels that have been triggered due to detected changes. This whitepaper outlines the various alert levels available and the additional programming options to fine tune the detection of alert conditions.
Measurement Types
There are various measurements that can be used as trigger inputs based on the product and connections. Of course, all products will have voltage triggers available. Voltage is the primary and most often used measurement value used for alerts. If current is available then it and real power may also be used as triggers. The measurements and associated trigger points each act independently. Multiple types of triggers on one or more channels can be set and each will generate its own alert message if the conditions for triggering are met.
Theory of Operation
Boomerangs, Revolutions, and Guardians each sample data inputs and then perform appropriate calculations on the gathered values to produce one-second averages for each desired measurement. The resultant one-second averages are the input values for the alert triggering mechanism. Alert triggers are specified as thresholds above and below the expected values for each measurement type. The thresholds are designed to define an expected window of normal operation, a band of high or low operation and an upper or lower extreme limit. Each time a measured value crosses into one of these zones an alert will be triggered. The contents of the alert will show the device serial number, the boundary crossed, the value that caused the alert, the time of occurrence and the device channel. An alert will be generated when the threshold is crossed in either direction so that successive alerts can show a timeline of abnormal behavior and the return to normal operation.
On the face of it this triggering mechanism is simple but of course, there are nuances that must be considered. For example, an input value may hover at or near a programmed threshold and cause an alert to be sent for each minor up or down variance of the measured value. Another example might have a value that briefly exceeds a threshold but if a brief peak is considered normal operation then no alert would be needed. These types of extraneous alerts can be avoided by additional programming parameters used to fine tune the detection of an alert.
Trigger Parameters
As mentioned above, the parameters for triggering an alert consist of individual thresholds per measurement type for each channel of the device. These thresholds can define simple boundaries or a warning zone along with a boundary condition. The thresholds listed here are available for each measurement and channel on the device.
- Low Low: This is the extreme lower limit of a measurement. It must always be numerically less than all other parameters for proper operation.
- Low: This setting can be used to define a low warning zone for a measurement when used in conjunction with the LowLow setting. This value must be numerically greater than the LowLow setting and less than the High setting. Measurements greater than this setting and less than the High setting are considered to be the normal expected range of operation.
- High: This setting can be used to define a high warning zone when used in conjunction with the HighHigh setting. This value must be numerically greater than the low settings and less than the HighHigh setting. Measurements less than this setting but greater than the Low setting are considered to be the normal expected range of operation.
- High High: This is the extreme upper limit of a measurement. It must always be numerically greater than all other thresholds for proper operation.
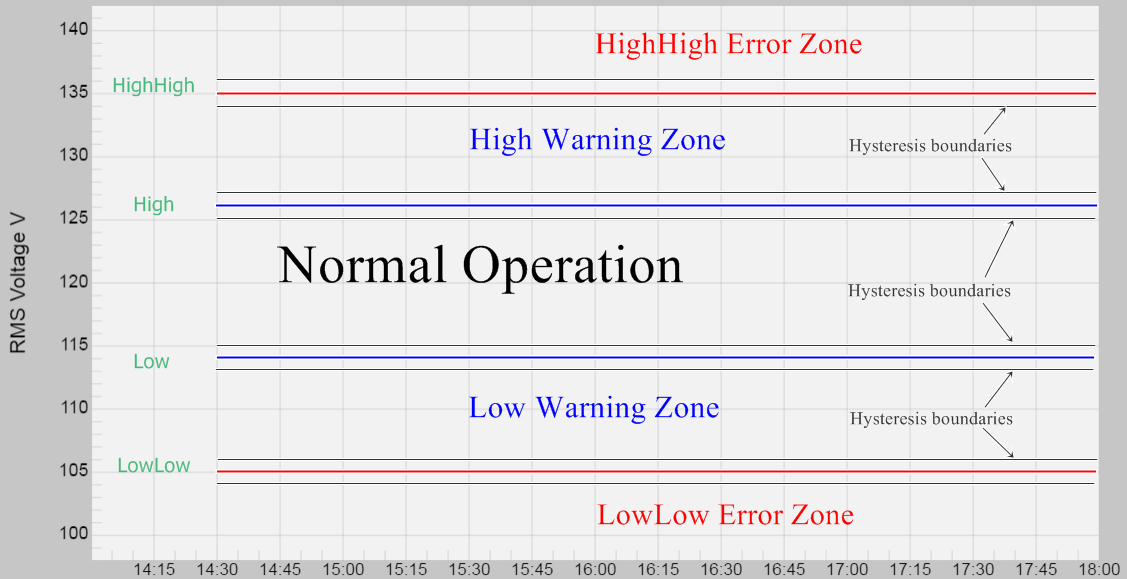
Any of these settings can be set to zero to disable them. This would allow just simple limits to be set around the expected range of operation or to only alert for high or low conditions. Figure 1 shows an example of thresholds set above and below a typical 120v nominal RMS input.
In addition to the individual thresholds, there are also parameters that apply to all thresholds and all channels for fine tuning the desired trigger points. These parameters are used to avoid excessive alerting for boundary conditions or to smooth out short term variance in the measurements.
- Holdoff time: The hold off time is specified in seconds. It defines the number of consecutive seconds that a measurement must exceed a threshold before it triggers an alert. The minimum value of the hold off time is 1 second and its maximum is 1800 seconds (30 minutes). This can be used to filter single high or low measurements or brief periods of abnormal measurements from triggering an alert.
- Average window: The averaging window is also specified in seconds. It defines the number of seconds over which the input values will be averaged before they are used to test against the threshold values. The minimum averaging window is 1 second (disabled) and the maximum is 1800 seconds (30 minutes). The averaging window will smooth out variations in measurements that may otherwise have frequent deviations from the norm. This is a sliding window, updated once per second.
- Hysteresis: The hysteresis value does not have any units associated with it. It is a numeric value ranging from 0-100 that will assume the units of each individual threshold. It is used as a pad value that defines a narrow band above and below each threshold. A measurement must exceed the programmed threshold plus (or minus) the hysteresis value in order for that measurement to be used for alert triggering.
The sequence of using these additional parameters is as follows. A measurement is first averaged into the programmed averaging window set of values. The averaged measurement is then compared against the adjacent thresholds with applied hysteresis. If it has exceeded a threshold (hysteresis included) then it will be used to start counting against the hold off time. It is important to note that the hold off time applies only to consecutive measurements that remain within a programmed zone. If a measurement crosses a threshold before the hold off time limit has been reached then the hold off time begins anew and no alert will be generated.
Example
Figure 2 shows a somewhat unrealistic threshold set at 119 volts as indicated by the blue line. However, for this example, the snippet of a one-second interval voltage stripchart works well to highlight the type of variation that can occur. Refer to figure 2 for each of the scenarios below. Each is assumed to be monitoring a nominal 120 volt input and have a single low threshold set at 119 volts.
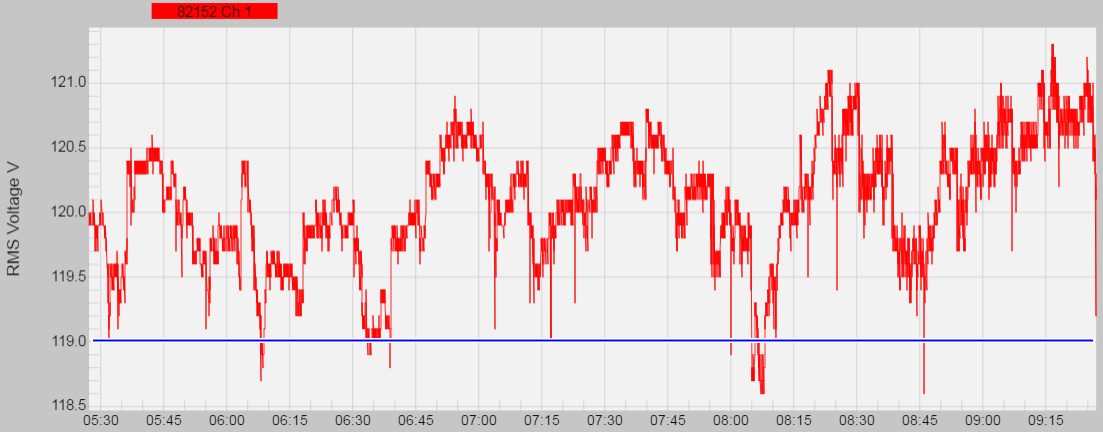
- Scenario 1 (hold off = 1, averaging = 1, hysteresis = 0): With no fine tuning of the alerts this scenario will generate up to 10 alerts in the 4-hour span shown. An alert is generated for values that cross a threshold based on the previous one-second measurement. An alert will be generated for both entering a new zone (low in this example) and when it returns back to the normal operating zone. So, for each reading below the threshold a low alert is generated and some time after a return to normal alert is sent.
- Scenario 2 (hold off = 60, averaging = 1, hysteresis = 0): A programmed hold off time means the value must stay in the zone for that number of seconds in order to generate an alert. In this scenario, the example would only generate 2 alerts in the 4-hour span. The low point at approximately 08:06 lasted for longer than 60 seconds so a low alert and subsequent back to normal alert would have been generated.
- Scenario 3 (hold off = 1, averaging = 1, hysteresis = 5): The hysteresis is an additional amount that must be exceeded beyond the threshold in order for it to be counted as entering a zone. A hysteresis value of 5 (equivalent to 0.5 volts) would cause no alerts to be generated for this example. The threshold is set at 119 volts. Factoring in the hysteresis means a measurement would have to be below 118.5 volts before an alert would be generated. The various measurements below 119 volts were not low enough to overcome the added hysteresis value.
- Scenario 4 (hold off = 1, averaging = 300, hysteresis = 0): An averaging window will smooth out the measurements over the given time period. An averaging window of 300 seconds (5 minutes) will allow 2 alerts to be generated in the 4-hour span. The period from 08:05 to 08:10 has many points below the threshold that would cause the 5 minute average to drop below 119 volts. A subsequent return to normal alert would occur shortly after.
Conclusion
The cellular alerting capabilities of various PMI products allow for quick notification of potential problems. Monitoring for voltage change is an obvious and common use but with a little creativity, other alerts could signal more specific events. For example, an alert based on amperage could signal a device is running or cycling on and off properly. The multiple types of alerts available and the ability to fine tune the triggering of alerts means that the user can filter out all but the most important information.
