Abstract
Waveform capture is one of the most important data types available for PQ analysis. The sample-level data provides detailed information for voltage disturbances such as oscillatory transients, notches, sub-cycle overvoltages etc. The high time resolution also provides cycle-by-cycle RMS information via the RMS Capture graph, generated from the waveform data. This high resolution is very useful for motor start studies, and both sample and RMS data are important for generator or dual-supply switching studies, etc. Unfortunately, waveform capture data requires high speed memory, and consumes it very quickly. Without a mechanism such as PMI’s PQ Canvass and cloud data storage, or ProVision scheduled downloads through cell modems to provide essentially unlimited memory, the PQ recorder’s local waveform memory must be managed through the waveform capture settings to make optimal use of it. A key parameter is the waveform capture sample rate. Reducing this increases the total number of waveform cycles that can be stored, but also involves trade-offs in data resolution. Guidelines for this parameter are presented here.
Waveform Capture Records
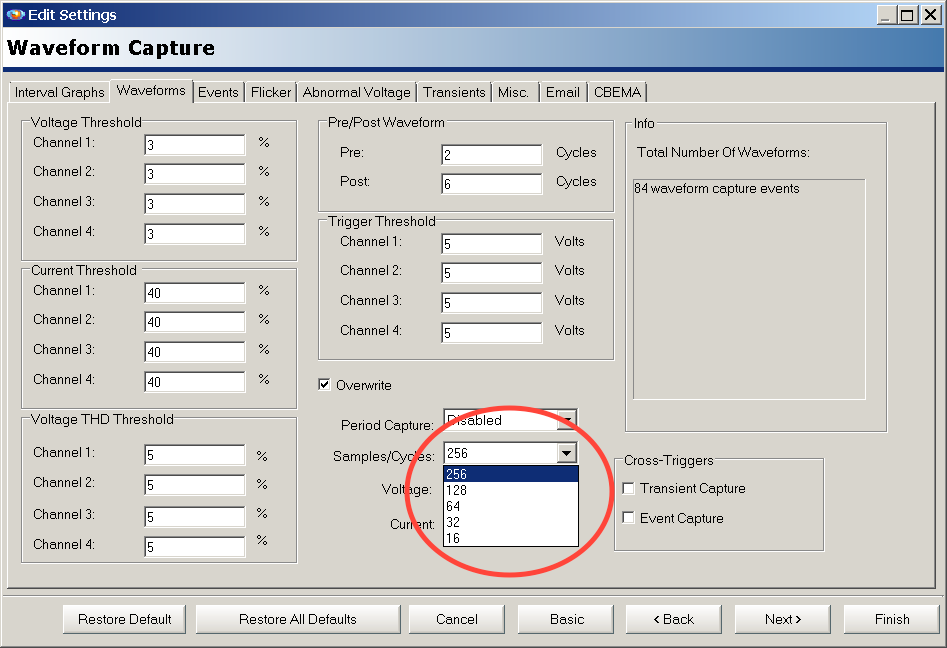
A waveform capture record includes sampled voltage and current data for all enabled channels. The default configuration results in a capture at the highest sampling rate of the recorder, typically 256 samples per cycle. The waveform sample rate is adjustable in many PMI recorders, including the Revolution, Guardian, and Eagle series. The rate may be set to 256, 128, 64, 32, or 16 samples per cycle, as shown in Figure 1. It’s important to note that the recorder is always sampling and compute voltage, current, harmonics, etc. at the full sampling rate (e.g. 256 samples per cycle) — this adjustment only affects the rate used for data storage in waveform capture events.
A rate of 256 samples per power line cycle gives a sampling frequency of 60 × 256 = 15,360 Hz, and a sample width of 1/15360 = 65.1 microseconds. With this rate, a time resolution of 65 μs is achieved for voltage transients and other disturbances. Halving the sampling rate also halves the time resolution, as shown in Table 1. For the available capture rates, the time resolution ranges from a very fast 65 μs to a very slow 1.041 milliseconds. Rates at 64/cycle or below may be too slow for good time resolution for sub-cycle transients, especially for determining the peak of oscillatory events or true voltage notch width.
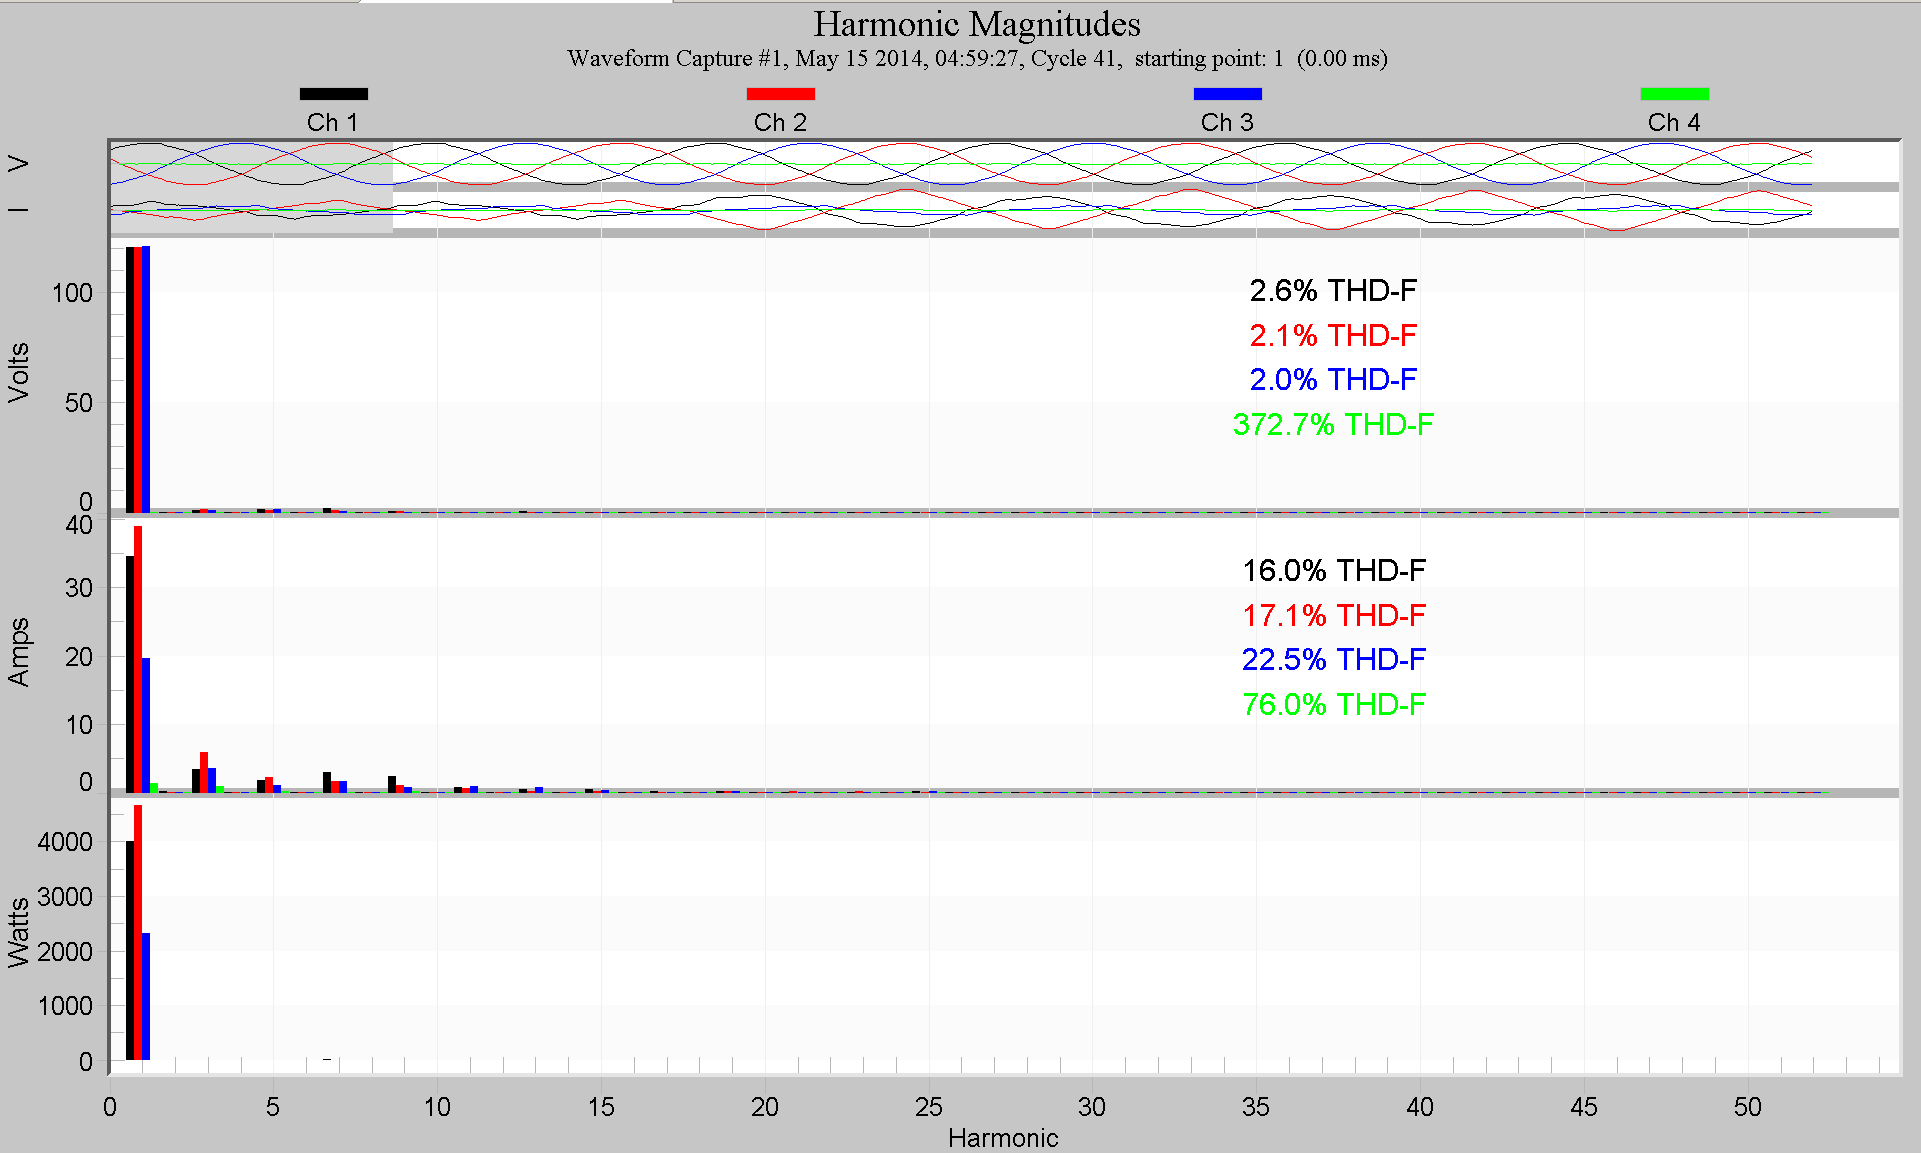
The sample rate also affects the harmonic information that can be extracted from the waveform capture data in ProVision. As described in Harmonics from Periodic Waveform Capture, this is a powerful alternative technique for harmonic analysis without using stripchart data. An example is shown in Figure 2, where a harmonic bar chart to the 51st is drawn for voltage, current, and power. Lowering the sample rate also lowers the maximum harmonic number that’s computable from the data. The Nyquist theorem states that the highest frequency component available in the sampled data is half the sampling frequency. Using 256 samples per cycle, the sampling frequency is 256 × 60 = 15,360 Hz. Half that is 7,680 Hz, which corresponds to 7680/60 = the 128th harmonic. The “60” term can be canceled out of the relationship, so that a sampling rate of N samples per cycle results in a max harmonic number of N/2. The max harmonic available for each sample rate is shown in Table 1. ProVision computes up to the 51st, so the 256 and 128 rates are both suitable, and identical for this purpose. At 64/cycle, the max harmonic is the 31st — often high enough, but limited compared to the 51st. Rates of 32 or 16/cycle are too low to get reliable harmonic information from waveform data.
| Samples Per Cycle | Time Resolution, Microseconds | Max Harmonic | Notes | Recommended Use |
|---|---|---|---|---|
| 256 | 65.1 | 127 | Highest time resolution, for oscillatory transients and narrow notches, excellent frequency and RMS value | Transients, notches, harmonics |
| 128 | 130.2 | 63 | Good time and frequency resolution, excellent RMS values | Transients, notches, harmonics, faster motor starts or limited channels |
| 64 | 260.4 | 31 | OK frequency resolution, RMS values | Motor starts |
| 32 | 520.8 | 15 | RMS values for low to mid-distortion waveforms | Motor starts with mid to low-harmonic waveforms |
| 16 | 1041.7 | 7 | Fair RMS values for low-distortion waveforms only | Motor starts with low harmonic waveforms |
It’s clear that lowering the sample rate for waveform capture data reduces time resolution, and also reduces the harmonic information available. There is one benefit though — increasing the maximum length of a capture. Squeezing more waveform cycles into the fixed recorder memory is the only reason to consider lowering the capture rate. The most common application for long waveform captures is for motor start studies. With a motor start recording, the entire motor in-rush time can be recorded with a single, long waveform capture. Very large motors may take several seconds to fully spin up, and a continuous RMS graph of voltage and current is very useful. ProVision computes this RMS capture graph from the raw waveform data, and here a low sampling rate can be essential. For RMS values, high time or frequency resolution isn’t usually required, and a sampling rate of 64 or even 32/cycle is often adequate.
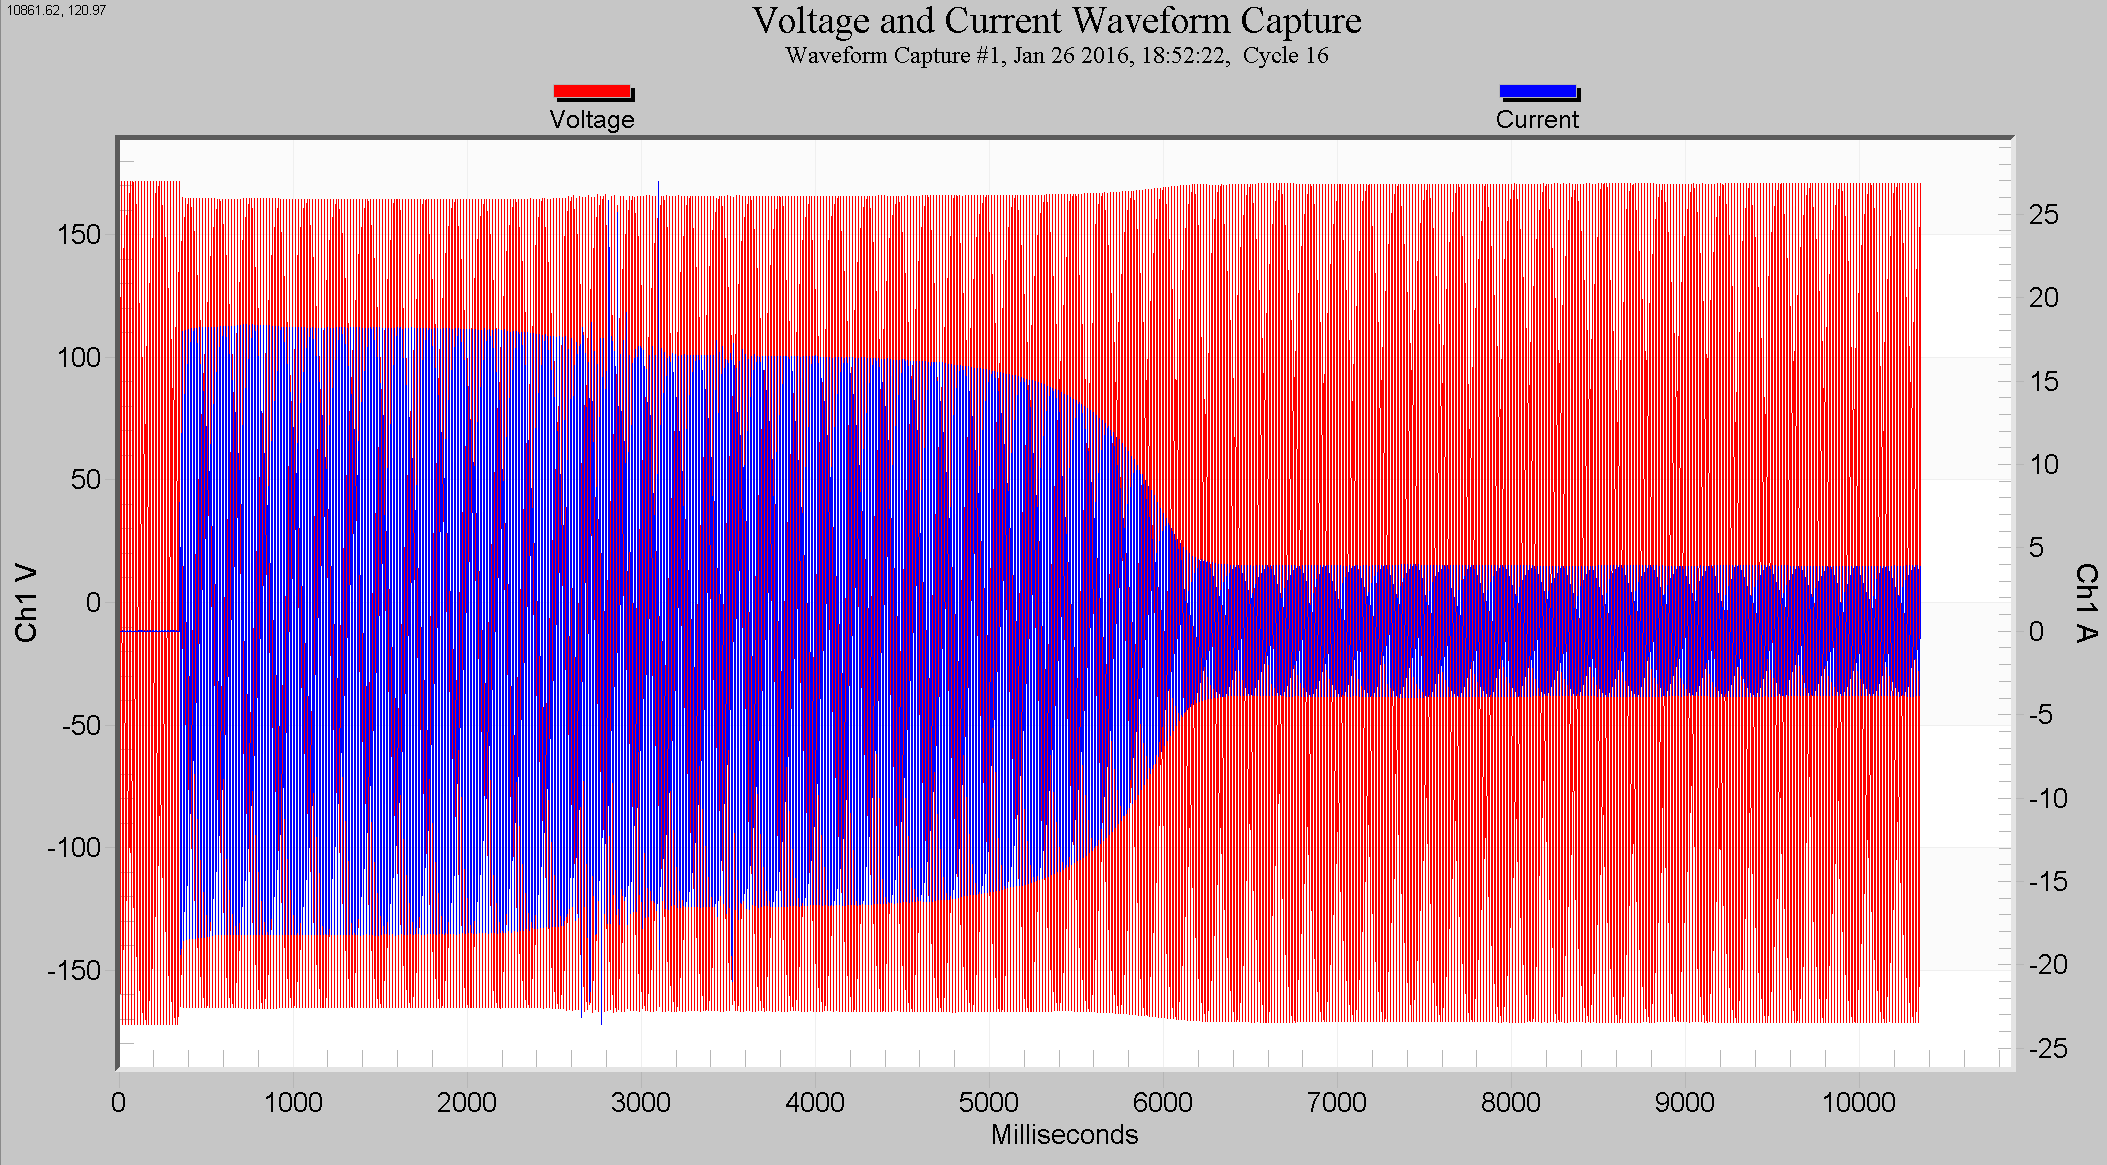
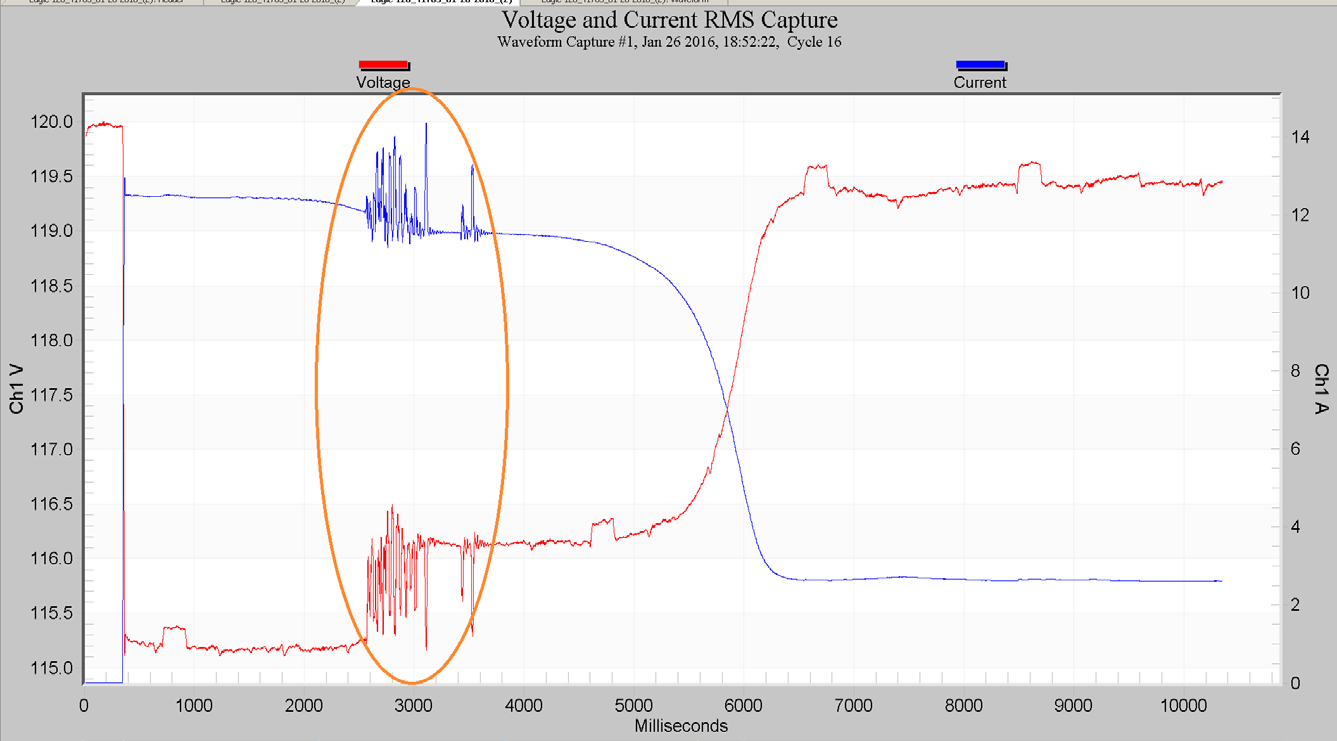
To record the entire event in one capture requires a very long waveform capture, like that shown in Figure 3. This is a single-phase motor with a 10 second waveform capture (over 600 cycles), with voltage in red, current in blue. It’s difficult to see any real detail on a sample-by-sample basis, but the RMS graph of the same capture is much more revealing (Figure 4). There’s a 5V drop as soon as the motor starts, a slow decay in current from 13A to about 10A that lasts around 5 seconds, then a much steeper drop in current that takes around a second. By 7 seconds the motor is fully started. In this situation, a mechanical problem with the motor from about 2.5 to 3.5 seconds (circled in orange) caused high spikes in current, up to the locked rotor current of 14A, with corresponding voltage fluctuations. Even these quick “spikes” last for at least 10 milliseconds as seen in Figure 5. The individual data points are also marked in this graph, showing the time resolution available at this reduced sample rate.
In this example, the sample rate was reduced to 128 per cycle to allow for a 10 second (600 cycle) capture. Even at this rate a Revolution can only fit a single four-channel capture in memory. To fit multiple motor starts, or a start and stop sequence in the same recording would require reducing the number of channels, or dropping the sampling rate to 64 per cycle. With this motor there is plenty of resolution at the 128/cycle level shown in Figure 5, and here 64 would also be fine, and 32 workable. If all four channels were required, 32 samples/cycle would allow for 9 waveform captures at 10 seconds each. A low rate such as 64 or 32 is marginal for a harmonic analysis or detailed transient breakdown, but can be perfectly adequate for RMS graphing of slow motor starts, especially if the current waveform is not very distorted.
Recommendations for the sampling rate are shown in the “Recommended Use” column of Table 1. The highest rates, 256 and 128, are excellent for general purpose transient analysis (e.g. capacitor bank switches, voltage notches), along with periodic waveform capture harmonic breakdowns. A value of 128/cycle may be used to increase the frequency of waveform snapshots for better coverage throughout the recording session (e.g. going from 256 to 128 samples/cycle may enable waveform snapshots every hour instead of every four hours in a certain timeframe). For motor starts, 128 or 64 samples per cycle are good choices, leaning towards higher rates for variable frequency drive motors, which present more complex waveforms with higher frequency components. Simple, slow motors with very long start-up times may use 64 or 32 samples/cycle. The lowest rate, 16/cycle, should only be used if required for very long captures on direct-drive AC motors with sinusoidal waveforms.
Conclusion
Waveform capture data provides the lowest level of data possible. It’s useful directly, and also as an input for harmonic analysis and RMS graphing. Without streaming data to PQ Canvass or offloading data via cell modem to ProVision, waveform capture storage is limited to the high-speed memory onboard the PQ recorder itself. By tailoring the captured sample rate to the analysis at hand, this memory may be optimally filled to provide either high resolution short captures, or lower resolution longer captures. Guidelines are presented here to select the best waveform capture sampling rate for each recording.
