Overview
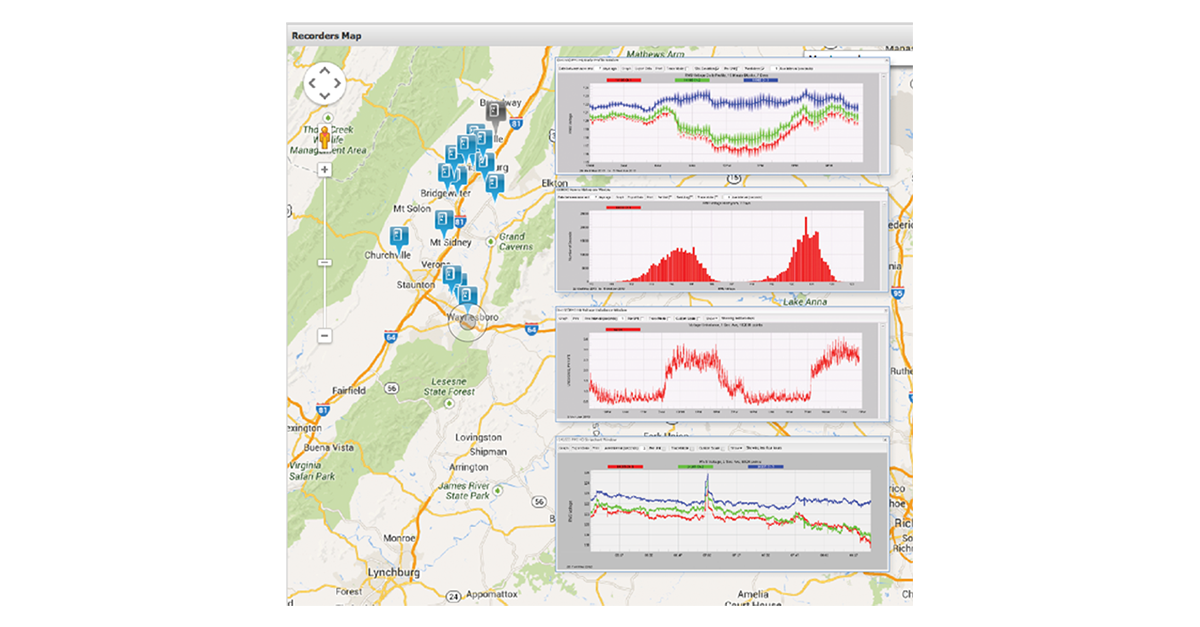
When used with the Canvass cloud system, the recorder collects data on a one second basis. Every few minutes, one-second values are sent to the PMI data center. With this system, all data collection is performed continuously; NO data is stored in the device, and NO recording download operation is required by the user. All historical data is available in a web browser, accessible through powerful graphs and reports. Fine-tune your CVR system by using Canvass to analyze voltage trends and regulator responses over geographic regions. Canvass can also be configured to send e-mail and text messages based on events, for immediate action outside your SCADA system.
Stripchart
The default stripchart graphs the last four hours of data, using 1 second values. The stripchart start and stop times can be changed to several built-in values (e.g. the last week, last month, etc.) or adjusted to any custom date range. These graphs can include all data ever recorded by your device. There’s no limit to the size of the graph; since your PMI recorder is continuously sending data to the database, there are no start or stop times in a recording.
Daily Profile Graph
Particularly useful for monitoring voltage regulation, Canvass Daily Profiles graphs are a great tool for spotting issues with both short and long term voltage trends. The Daily Profile graph show the “average” 24 hour period, for the selected timespan. The user specifies a time frame of a single day or even up to several months and Canvass returns a graph of the “average day” over the duration of the specified time frame.
The Daily Profile graph has several adjustable parameters: Time Span, Standard Deviation, Per Unit, Weekdays Only, and Averaging Interval. Daily Profiles are an average of the RMS voltage, current and power over the specified averaging interval for each day in the specified timespan. Graph standard deviation to display the specific variance throughout a specified time span for a particular time point.
Histogram
The Canvass Histogram graph is a powerful tool to characterize the probability distribution of voltage at a particular location. The shape of the graph, coupled with the statistical analysis, can reveal patterns in the service voltage, and also help quantify a level of service on a statistical basis.


